In this post I will describe the process of visualizing the Chromium include graph with the help of one of my side projects - clang-include-graph.
The main motivation for this work was to test the new release of clang-include-graph against a large code base.
In the next sections I will describe all steps needed to reproduce the final graph, including building Chromium to obtain the compile_commands.json and generating a GraphML include graph representation using clang-include-graph, which will then be used to visualize the graph using Gephi, but if you’re in a hurry:
Table of contents
Open Table of contents
clang-include-graph overview
clang-include-graph is a simple Clang-based command line tool for analyzing C/C++ project include graphs. As of version 0.2.0 it provides the following features:
- Generating include graph in several formats:
- Topologically ordered include list
- Include tree and reverse include tree
- Include graph cycles detection
- Listing of all dependents of a specified header file
- Parallel processing of translation units
In this post we will focus on the GraphML output feature of clang-include-graph and how it can be used to visualize and analyze the include graph of the Chromium source code using existing open-source software.
Generating the include graph
Building Chromium
Since clang-include-graph is a Clang-based tool, before we can generate the GraphML file include graph, we need to generate the compile_commands.json file for the Chromium source.
For reproducibility, I created a Docker image with some helper scripts to fetch and build Chromium as well as generate the GraphML files - it is available here.
Below I will however present how these steps can be performed manually. We’ll assume that we’ll be working in /build directory, which corresponds to the volume mount in the Docker container.
Fetching Chromium sources
git clone https://chromium.googlesource.com/chromium/tools/depot_tools.git
mkdir -p chromium
cd chromium
export PATH=$PATH:/build/depot_tools
fetch --nohooks --no-history chromium
gclient runhooks
For reference, the specific Chromium commit we’ll be working on is dated for May 13, 2025:
$ git -C chromium/src log
commit 48d682cce8e29049011b34f8e753b9dc4f73181e (grafted, HEAD, origin/main, origin/HEAD)
Author: Michael Slutskii <slutskii@google.com>
Date:   Tue May 13 05:06:05 2025 -0700
...
Generating compile_commands.json
Now, typically with C/C++ it is not necessary to actually build the project to generate the compile_commands.json, for instance CMake can generate one during the build files generation phase. However, Chromium contains a substantial amount of automatically generated code (no, I don’t mean LLM, but rather stuff like Protobuf and Mojo stubs…), which has to be available for Clang to properly parse all translation units. Since I was not able to find a way to generate all these files without actually building entire Chromium - we’ll just to that and wait:
cd chromium/src
gn gen out/Default
tools/clang/scripts/generate_compdb.py -p out/Default > compile_commands.json
ninja -C out/Default chrome unit_tests browser_tests

# Remove .o files to reduce volume size - we only need sources and compile_commands.json
find . -type f -name '*.o' -exec rm -- '{}' \;
We can check the number of compile commands in compile_commands.json and unique translation units:
$ jq length compile_commands.json
71289

$ jq '.[] | .file' compile_commands.json | sort | uniq | wc -l
68505
For reference, the compile_command.json I got can be downloaded from here.
If any of these steps didn’t work for you or you need to adjust something, see the original Chromium build docs.
Generating the graph
Now that we have the compile_commands.json file, we can generate the GraphML with the include graph using clang-include-graph:
cd chromium/src/out/Default
clang-include-graph -v 1 --graphml \
  --compilation-database-dir /build/chromium/src \
  --relative-to /build/chromium/src --relative-only \
  --remove-compile-flag "-fextend-variable-liveness=none" \
  --remove-compile-flag -Wno-nontrivial-memcall \
  --add-compile-flag -Wno-unknown-pragmas \
  --remove-compile-flag -fcomplete-member-pointers \
  --remove-compile-flag -MMD --jobs 32 \
  --add-compile-flag -fsyntax-only \
  -o /build/graphml/chromium_include_graph_full.graphml
Most options are hopefully self-explanatory, but just in case:
--graphml- we want to print the include graph in GraphML format--compilation-database-dir /build/chromium/src- where Clang should look forcompile_commands.json--relative-to /build/chromium/src- all rendered paths in the output graph should be relative to this path--relative-only- we only want to include files in the output graph that are relative to the/build/chromium/src(i.e. no system headers in the graph, however since Chromium comes with it’s own C++ headers inthird-partydirectory this doesn’t change much)--remove-compile-flagand--add-compile-flag- as is typical with Clang based tools, we often need to adjust the compile flags existing incompile_commands.jsonsomewhat
On my system - a desktop with AMD Ryzen, 16 cores (32 threads) and 64GB RAM - the generation took 3 hours and 13 minutes. The generated GraphML file itself is 150M, it looks like this from head and tail:
<?xml version="1.0" encoding="UTF-8"?>
<graphml xmlns="http://graphml.graphdrawing.org/xmlns" xmlns:xsi="http://www.w3.org/2001/XMLSchema-instance" xsi:schemaLocation="http://graphml.graphdrawing.org/xmlns http://graphml.graphdrawing.org/xmlns/1.0/graphml.xsd">
  <key id="key0" for="node" attr.name="file" attr.type="string" />
  <key id="key1" for="edge" attr.name="is_system" attr.type="boolean" />
  <graph id="G" edgedefault="directed" parse.nodeids="canonical" parse.edgeids="canonical" parse.order="nodesfirst">
    <node id="n0">
      <data key="key0">apps/switches.h</data>
    </node>
    <node id="n1">
      <data key="key0">apps/switches.cc</data>
    </node>
    ...
    <edge id="e1310549" source="n141247" target="n141245">
      <data key="key1">0</data>
    </edge>
    <edge id="e1310550" source="n141247" target="n141232">
      <data key="key1">0</data>
    </edge>
  </graph>
</graphml>
It’s essentially a list of <node> elements representing source files and headers, and <edge> elements representing include directives from source to target nodes. Each node contains a key0 property containing the relative path of the file, and each edge has a boolean property key1, representing whether the include was a system include (i.e. #include <...>), or regular (i.e. #include "...").
Now, the post title says that it’s the entire Chromium include graph, but with some caveats:
- we are only including source and header files that exist under
chromium/srcdirectory, no external system headers are included - we are only processing translation units included in the generated
compile_commands.json, which depends mostly on the platform (x84_64 Linux), so any files specific for other platforms (Windows, macos, Android) will not be included - we are only processing include directives that are not excluded by
#ifdefmacros due to default compile flags - any translation units that do not have any include files within
chromium/srcdirectory will be skipped
Graph statistics
Before doing the visualization, let’s calculate some basic graph statistics for this graph. For this purpose I’ve cooked a small Python script based on NetworkX graph library - you can find it here.
Running the script produces the following output:
$ python3 calculate_statistics.py ./chromium_include_graph_full.graphml
Loading graph from chromium_include_graph_full.graphml...
Calculating statistics...
Calculating basic metrics (nodes, edges)...
Calculating degree metrics (in/out degrees)...
Calculating degree centrality...
Finding strongly connected components...
Finding simple cycles...
Calculating average directed clustering coefficient...
Statistics calculation complete.
Graph Statistics:
- Number of nodes: 141248
- Number of edges: 1310551
- Maximum in-degree (most included): 23399
- Maximum out-degree (most including): 1131

Top 10 most included files (in-degree):
  third_party/libc++/src/include/utility: 23399
  third_party/libc++/src/include/memory: 21168
  third_party/libc++/src/include/string: 20801
  third_party/libc++/src/include/vector: 16486
  third_party/libc++/src/include/optional: 13053
  testing/gtest/include/gtest/gtest.h: 11635
  base/memory/raw_ptr.h: 9382
  build/build_config.h: 8993
  third_party/libc++/src/include/type_traits: 8170
  third_party/libc++/src/include/algorithm: 7738

Top 10 most including files (out-degree):
  out/Default/gen/third_party/blink/renderer/bindings/modules/v8/v8_window.cc: 1131
  chrome/browser/chrome_content_browser_client.cc: 498
  chrome/browser/profiles/chrome_browser_main_extra_parts_profiles.cc: 399
  third_party/blink/renderer/core/dom/document.cc: 368
  third_party/pdfium/xfa/fxfa/parser/cxfa_node.cpp: 357
  out/Default/gen/third_party/blink/renderer/bindings/modules/v8/v8_dedicated_worker_global_scope.cc: 328
  out/Default/gen/v8/torque-generated/exported-macros-assembler.cc: 319
  chrome/browser/ui/views/frame/browser_view.cc: 311
  out/Default/gen/third_party/blink/renderer/bindings/modules/v8/v8_service_worker_global_scope.cc: 309
  content/browser/renderer_host/render_frame_host_impl.cc: 307

Top 10 nodes by degree centrality:
  third_party/libc++/src/include/utility: 0.1658
  third_party/libc++/src/include/memory: 0.1501
  third_party/libc++/src/include/string: 0.1478
  third_party/libc++/src/include/vector: 0.1168
  third_party/libc++/src/include/optional: 0.0928
  testing/gtest/include/gtest/gtest.h: 0.0824
  base/memory/raw_ptr.h: 0.0664
  build/build_config.h: 0.0637
  third_party/libc++/src/include/type_traits: 0.0584
  third_party/libc++/src/include/algorithm: 0.0561

Number of strongly connected components: 140874
Size of largest strongly connected component: 92
Largest strongly connected component nodes:
  v8/src/sandbox/js-dispatch-table-inl.h
  v8/src/objects/tagged-impl-inl.h
  v8/src/objects/map-inl.h
  v8/src/objects/struct-inl.h
  v8/src/objects/transitions-inl.h
  v8/src/objects/objects-inl.h
  v8/src/handles/maybe-handles-inl.h
  # ... skipped a bunch of v8 headers
  v8/src/objects/heap-number-inl.h
  v8/src/objects/property-cell-inl.h
  v8/src/sandbox/cppheap-pointer-inl.h

Number of simple cycles: 7809709

Average clustering coefficient: 0.0842
Some key insights from these:
| Statistic | Value | Comment |
|---|---|---|
| Number of nodes | 141,248 | Every node is a source or header file |
| Number of edges | 1,310,551 | Every edge is a single #include directive |
| Most included file include count | 23399 | There is a file which is directly included 23,399 times. Actually over half of top 10 most included files are from third_party, and it’s a question whether we should include it as part of Chromium source visualization, but since we’re aiming for entire code base, let’s leave it for now and see |
| File with most #include’s include count | 1131 | There is a file with 1131 #include directives (with respect to the current compile flags) |
| Number of cycles | 7,809,709 | That sounds like a lot? We’ll look into it later… |
| Average clustering coefficient | 0.0842 | Suggests the graph does not contain too many clusters, but rather few large clusters |
| Number of strongly connected components | 140874 | There’s almost as many strongly connected components as there are nodes. As I understand, this is typical for directed graphs with mostly tree-like hierarchy. Most include paths don’t create cycles connecting separate components bidirectionally. |
| Size of largest strongly connected component | 92 | For some reason, the largest strongly connected component seems to be in v8 subdirectory. |
Visualization
Now that we know more less what we’re dealing with, let’s see this thing. After some experiments I chose an open-source project Gephi to generate the visualizations (version 0.10.1 for Linux).
A first naive attempt, after running YifanHu layout engine with default settings:
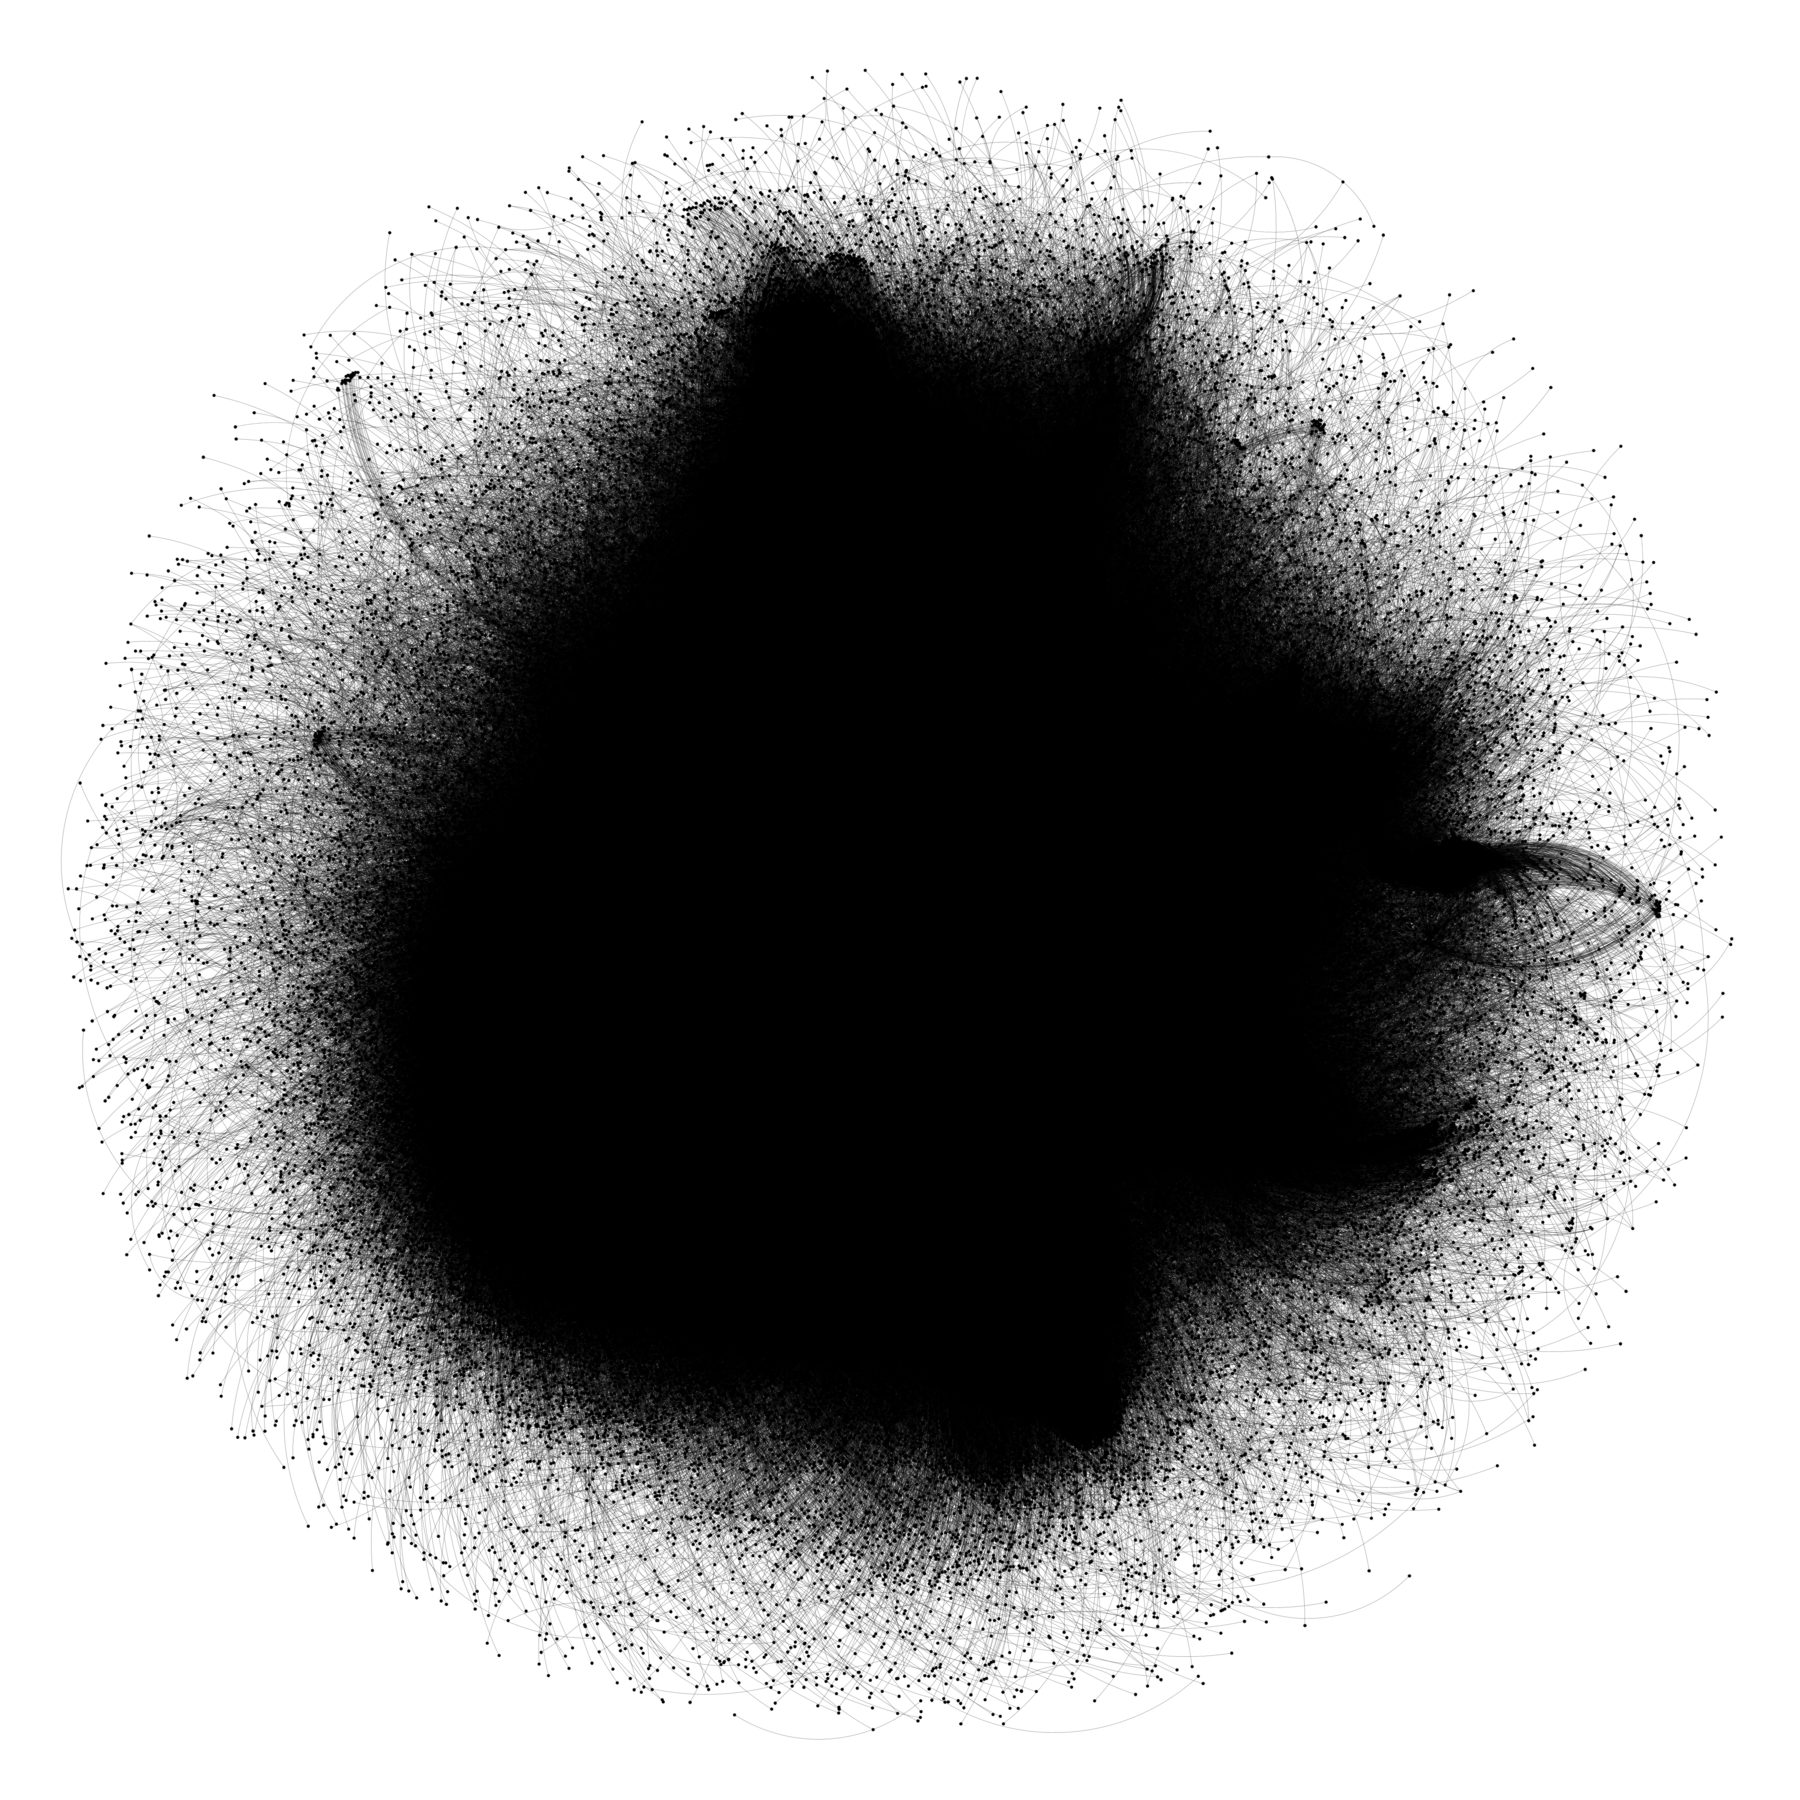
Yeah… this is not going to be very useful. We need to somehow add some additional information and play some more with available layout engines. Obviously we could add labels with include file paths, but at this scale this would just occlude the image even more. Let’s try something else:
- for each node, we can add a property representing the top level directory name in the
chromium/srcsubdirectory and call itcomponent(i.e.baseforbase/memory/raw_ptr.hnode) - for each node, we can add a color property based on the component name
- for 10 nodes with top in-degrees (most included files), we’ll add a separate
labelproperty, to be able to see which files are most included - ensure that for each component at least one header is labeled (the one with the highest in-degree)
- we’ll start small, generating separate graphs based on analyzing translation units in selected components (subdirectories), and then generate a graph using all translation units in
compile_commands.json
Annotating include graph using NetworkX
Below is a simple script, which adds the above mentioned annotations to the GraphML file obtained using clang-include-graph:
import networkx as nx
import argparse

def get_component(file_path):
    parts = file_path.split('/')
    return parts[0]

COLOR_MAP = {
    'third_party':  '#33CC33',
    'chrome':       '#FF33FF',
    'components':   '#FF9900',
    'out':          '#00CCCC',
    'content':      '#800000',
    'ui':           '#808000',
    'net':          '#7B68EE',
    'services':     '#0000FF',
    'media':        '#FF66CC',
    'extensions':   '#FF3399',
    'base':         '#20B2AA',
    'remoting':     '#8B4513',
    'cc':           '#87CEEB',
    'gpu':          '#228B22',
    'device':       '#006400',
    'mojo':         '#2F4F4F',
    'v8':           '#800080',
    'storage':      '#008080',
    'google_apis':  '#7FFF00',
    'sandbox':      '#556B2F',
    'pdf':          '#DAA520',
    'ppapi':        '#FF8C00',
    'headless':     '#008B8B',
    'ipc':          '#CD853F',
    'printing':     '#696969',
    'crypto':       '#E0FFFF',
    'gin':          '#FF0000',
    'tools':        '#A9A9A9',
    'skia':         '#DDA0DD',
    'url':          '#008B8B',
    'sql':          '#90EE90',
    'dbus':         '#D3D3D3',
    'testing':      '#C0C0C0',
    'apps':         '#4169E1',
    'build':        '#FF1493',
    'codelabs':     '#FFDAB9',
    'chromeos':     '#FA8072',
    'ash':          '#FF00FF',
}

def add_component_color_and_labels(graphml_file, output_graphml_file):
    G = nx.read_graphml(graphml_file)

    degree_map = dict(G.in_degree())

    top10 = sorted(degree_map, key=lambda n: degree_map[n], reverse=True)[:10]

    # Attach label properties to nodes
    for node, data in G.nodes(data=True):
        file_path = data.get('file', '')
        component = get_component(file_path)
        G.nodes[node]['component'] = component
        G.nodes[node]['color'] = COLOR_MAP.get(component, '#000000')
        if node in top10:
            G.nodes[node]['label'] = G.nodes[node].get('file', '')
        else:
            # This is a hack to force Gephi to not render node id when
            # label is empty
            G.nodes[node]['label'] = '____'

    # Ensure each component has at least one labeled node
    components = {data['component'] for _, data in G.nodes(data=True) if data.get('component')}
    for comp in components:
        comp_nodes = [n for n, d in G.nodes(data=True) if d.get('component') == comp]
        if not comp_nodes:
            continue
        best = max(comp_nodes, key=lambda n: degree_map.get(n, 0))
        G.nodes[best]['label'] = G.nodes[best].get('file', '')

    print(f"Nodes: {G.number_of_nodes()}")
    print(f"Edges: {G.number_of_edges()}")
    print(f"Dependencies: {', '.join(sorted(components))}")

    nx.write_graphml(G, output_graphml_file)

def main():
    parser = argparse.ArgumentParser(
        description='Annotate include graph nodes'
    )
    parser.add_argument('input_graphml',  type=str, help='Path to the input GraphML file')
    parser.add_argument('output_graphml', type=str, help='Path for the updated GraphML output')
    args = parser.parse_args()

    add_component_color_and_labels(args.input_graphml, args.output_graphml)

    print(f"Updated GraphML with component, color, and labels saved to {args.output_graphml}")

if __name__ == '__main__':
    main()
Below is the color map for reference:
| Component | Color | Component | Color |
|---|---|---|---|
| third_party | sandbox | ||
| chrome | |||
| components | ppapi | ||
| out | headless | ||
| content | ipc | ||
| ui | printing | ||
| net | crypto | ||
| services | gin | ||
| media | tools | ||
| extensions | skia | ||
| base | url | ||
| remoting | sql | ||
| cc | dbus | ||
| gpu | testing | ||
| device | apps | ||
| mojo | build | ||
| v8 | codelabs | ||
| storage | chromeos | ||
| google_apis | ash |
base subdirectory
First up is base subdirectory. It seems like a good place to start (at least for someone like me who doesn’t know anything about Chromium codebase), name suggests it’s probably common basic classes and utilities for the rest of the project.
We will generate a separate GraphML document by adding 2 flags to clang-include-graph:
--translation-unit "/build/chromium/src/base/**/*.cc" --output /build/graphml/chromium_include_graph_base.graphml
which means we’re only visiting translation units under base subdirectory and we’re writing the output to chromium_include_graph_base.graphml file. Then to generate the annotated graph we just call:
$ python3 annotate_include_graph.py graphml/chromium_include_graph_base.graphml annotate_include_graph.py graphml/chromium_include_graph_base_annotated.graphml
Basic statistics for this file are rather modest:
| Nodes | Edges | Dependencies |
|---|---|---|
| 3899 | 28811 | base, build, buildtools, out, testing, third_party |
Let’s see some layouts for this graph. Gephi provides several layout engines to choose from, but for the final graph there’s really only a few that will be able to deal with it’s size, in particular:
- YifanHu layout - efficient force-directed layout algorithm (see original paper)
- Circular layout - organizes the nodes on a circle ordered by their relative path in
chromium/src(i.e. files from the same components are close to each other) and the edges are contained within the circle - Circular pack layout - the nodes are clustered into hierarchies based on several factors, in our case first hierarchy is based on
componentproperty, and one sub-hierarchy is based on in-degree metric
so let’s stick with these for all components as well as the full graph.
The edge colors are a blend between the source and target node colors, so we can see which arrows represent includes internal to a given component (same color as component nodes), and which represent inter-component dependencies (mixed color).
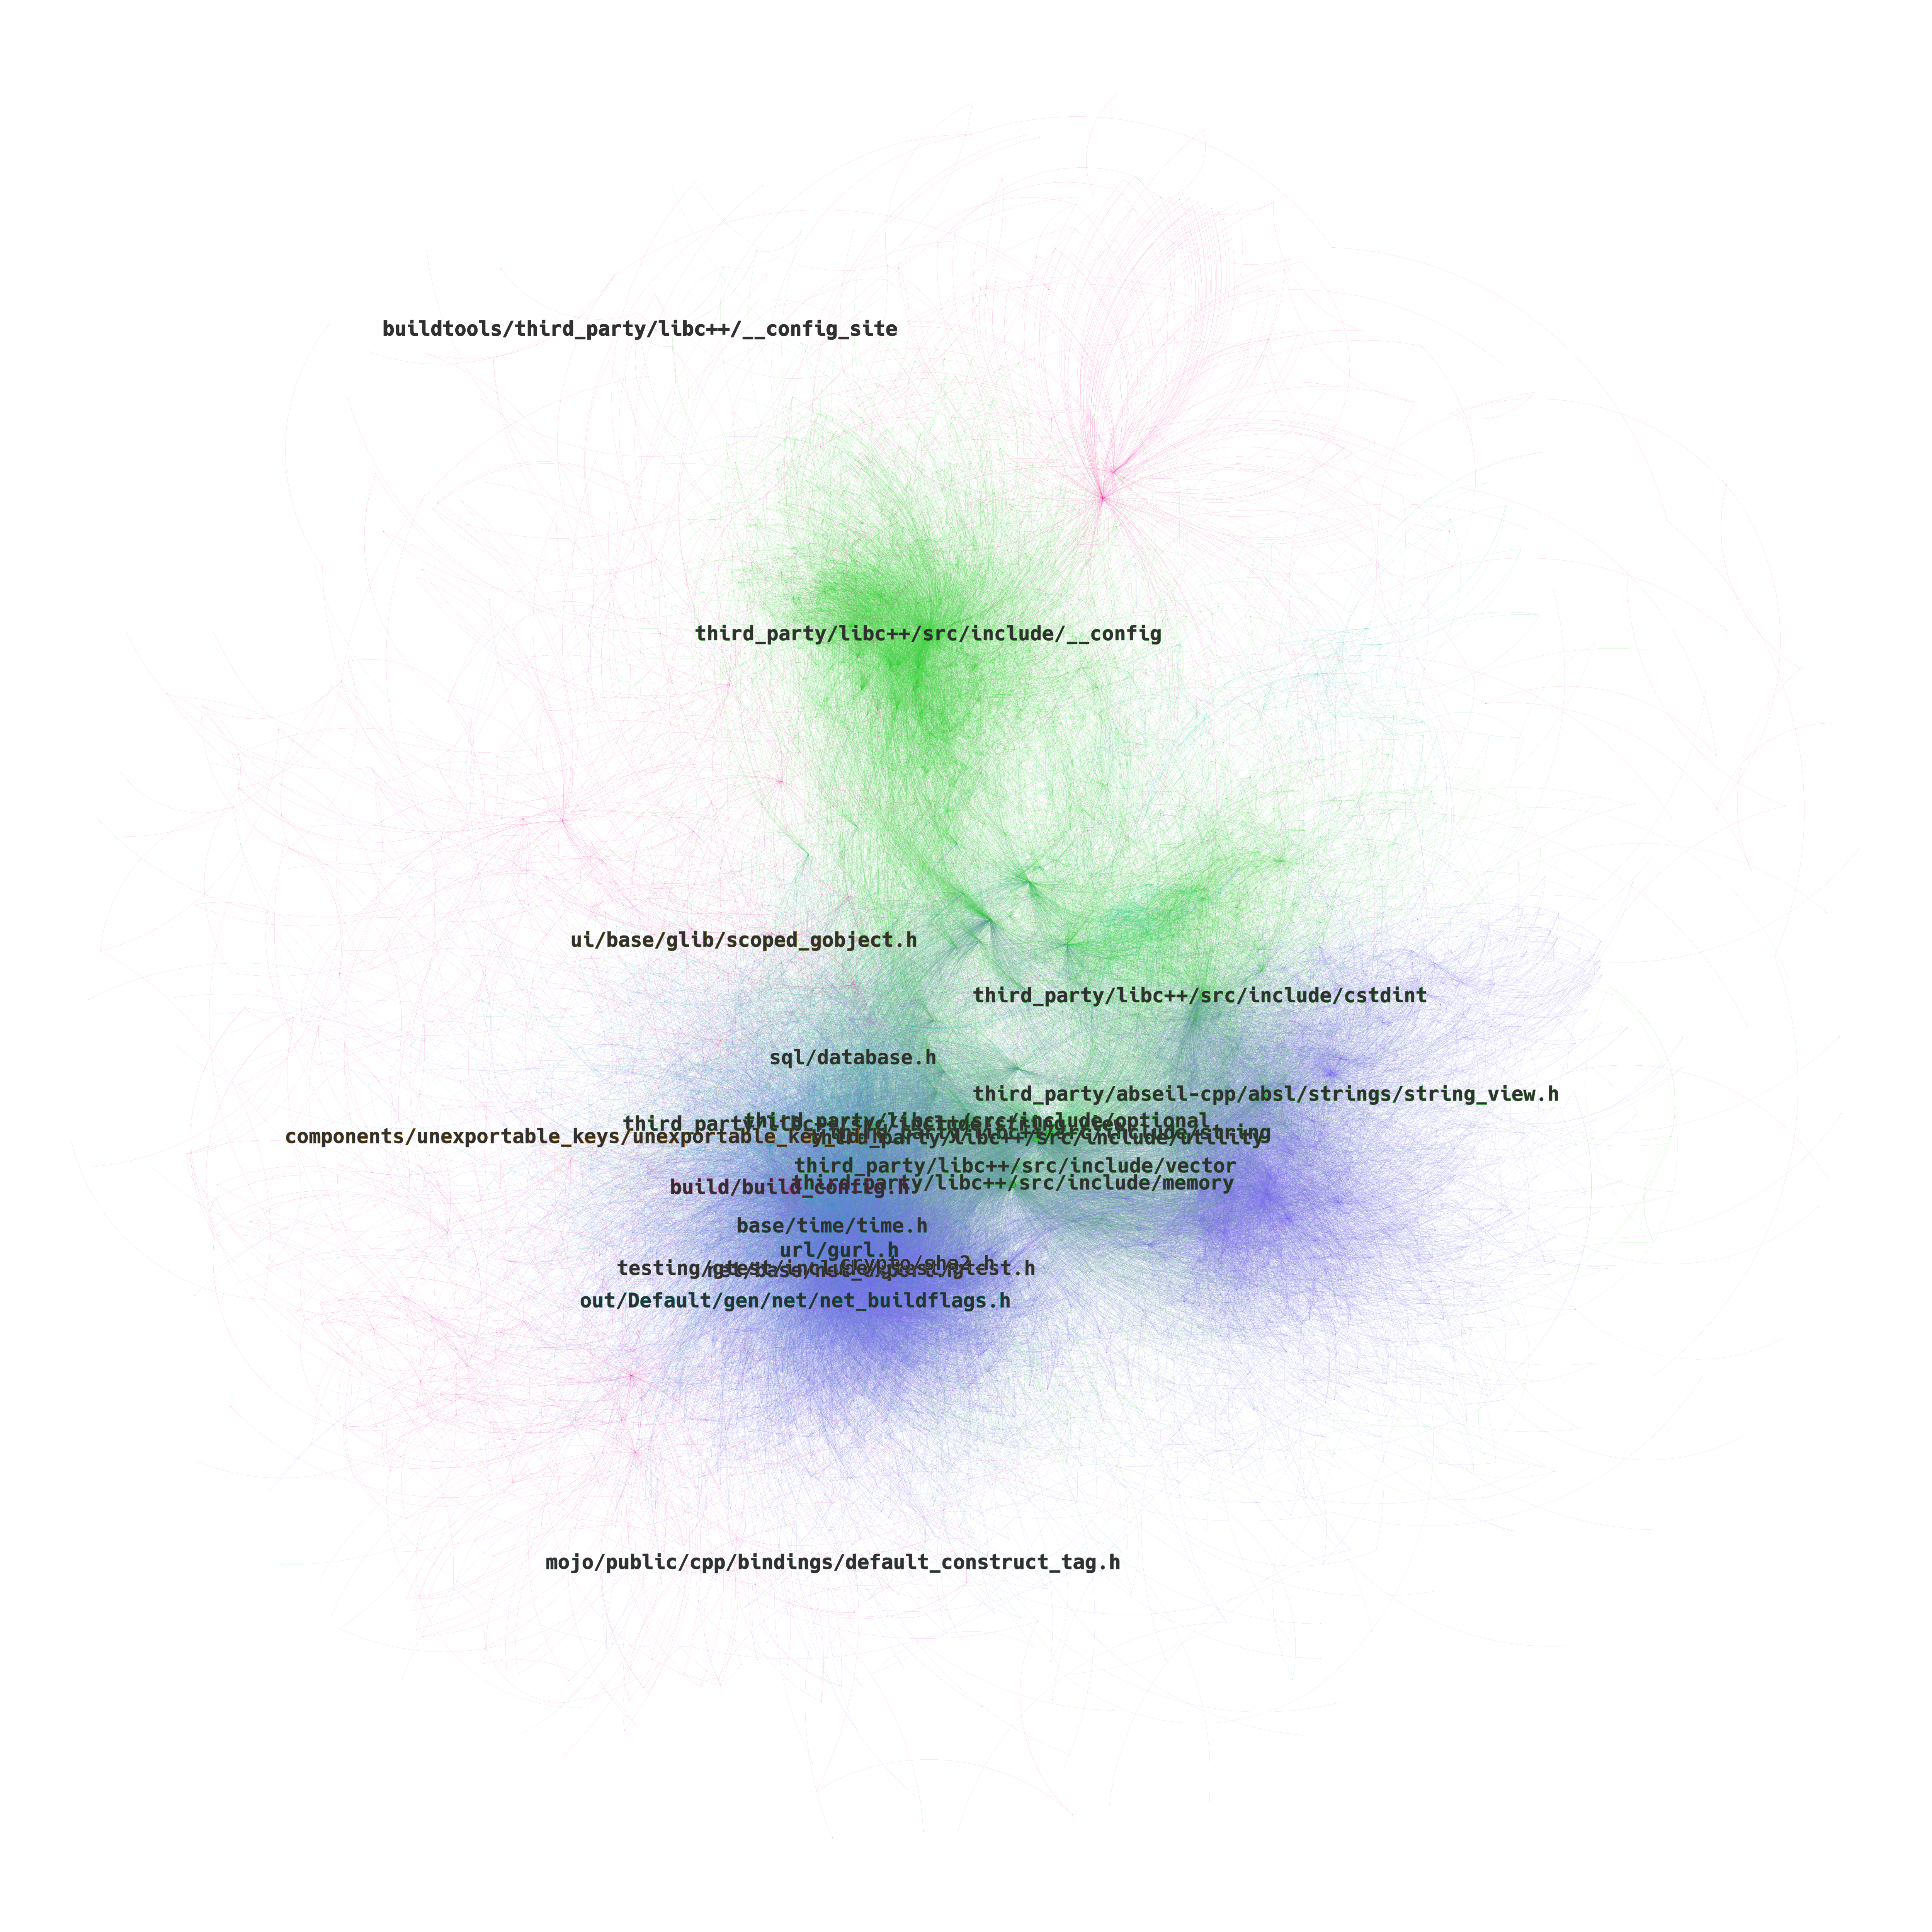
Yifan Hu layout
Ok, now at least we can see something. First of all, we can see that the larger nodes (headers directly included by many files), are placed in the center of the graph, and form 2 separate clusters (teal for base on the left and green for third_party on the right).
Another thing, is that almost all nodes and edges are contained within these 2 clusters (base and third_party subdirectories), with some interconnection between base and third_party (representing dependencies from base to third_party).
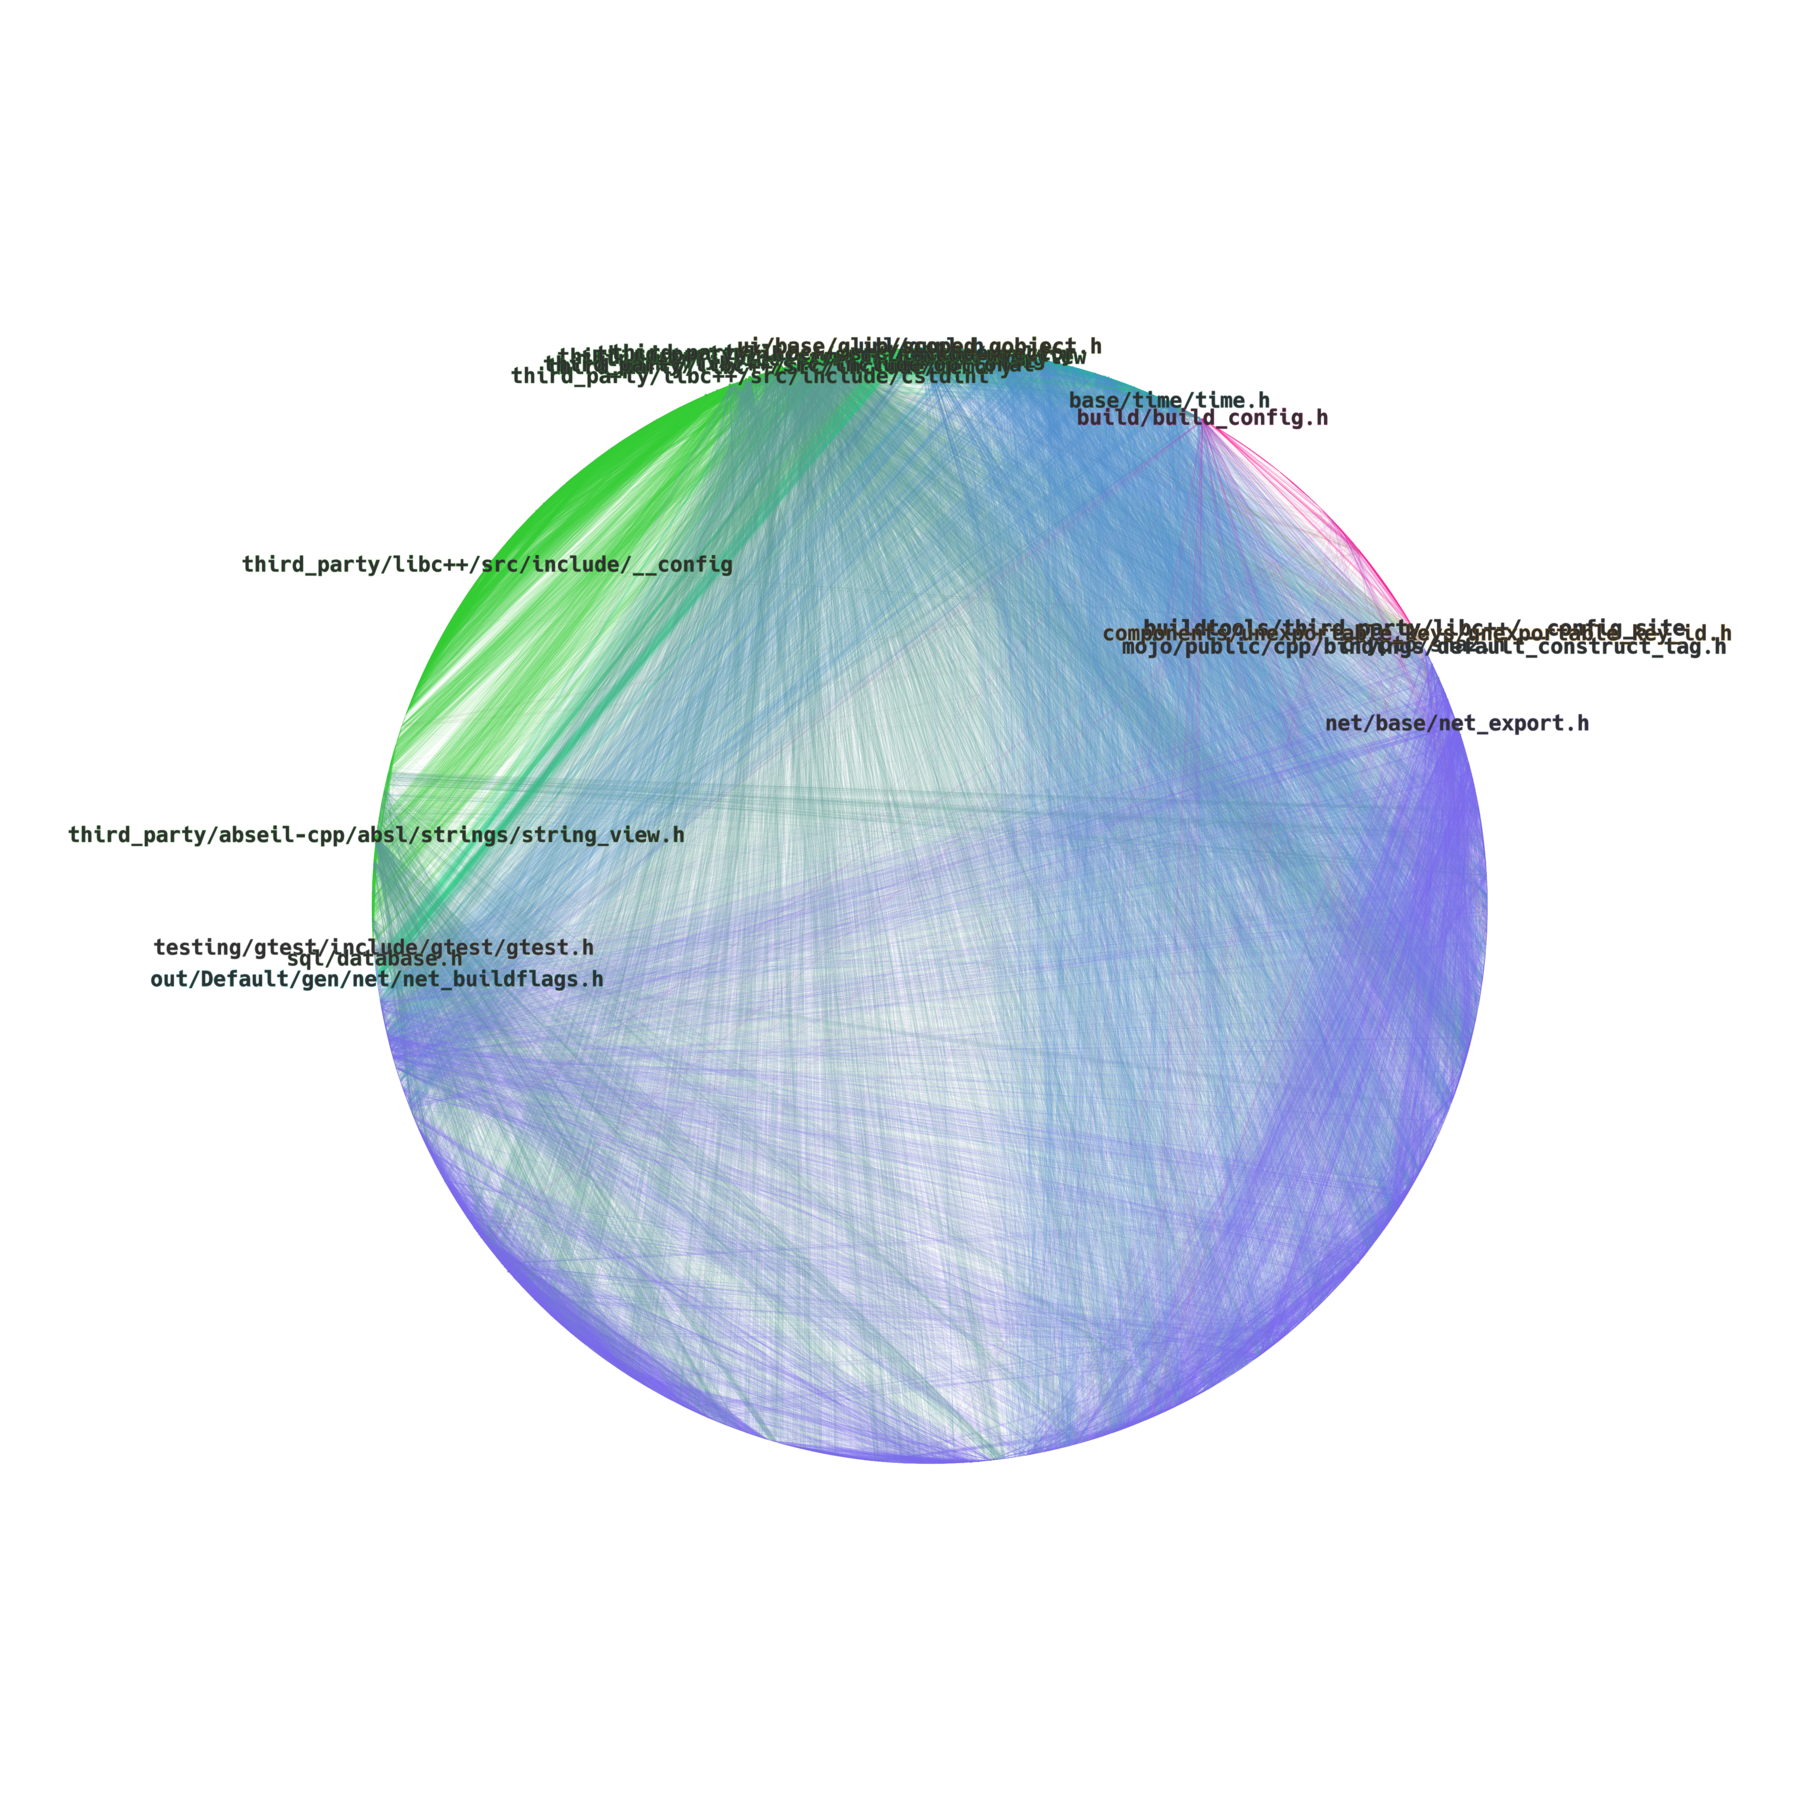
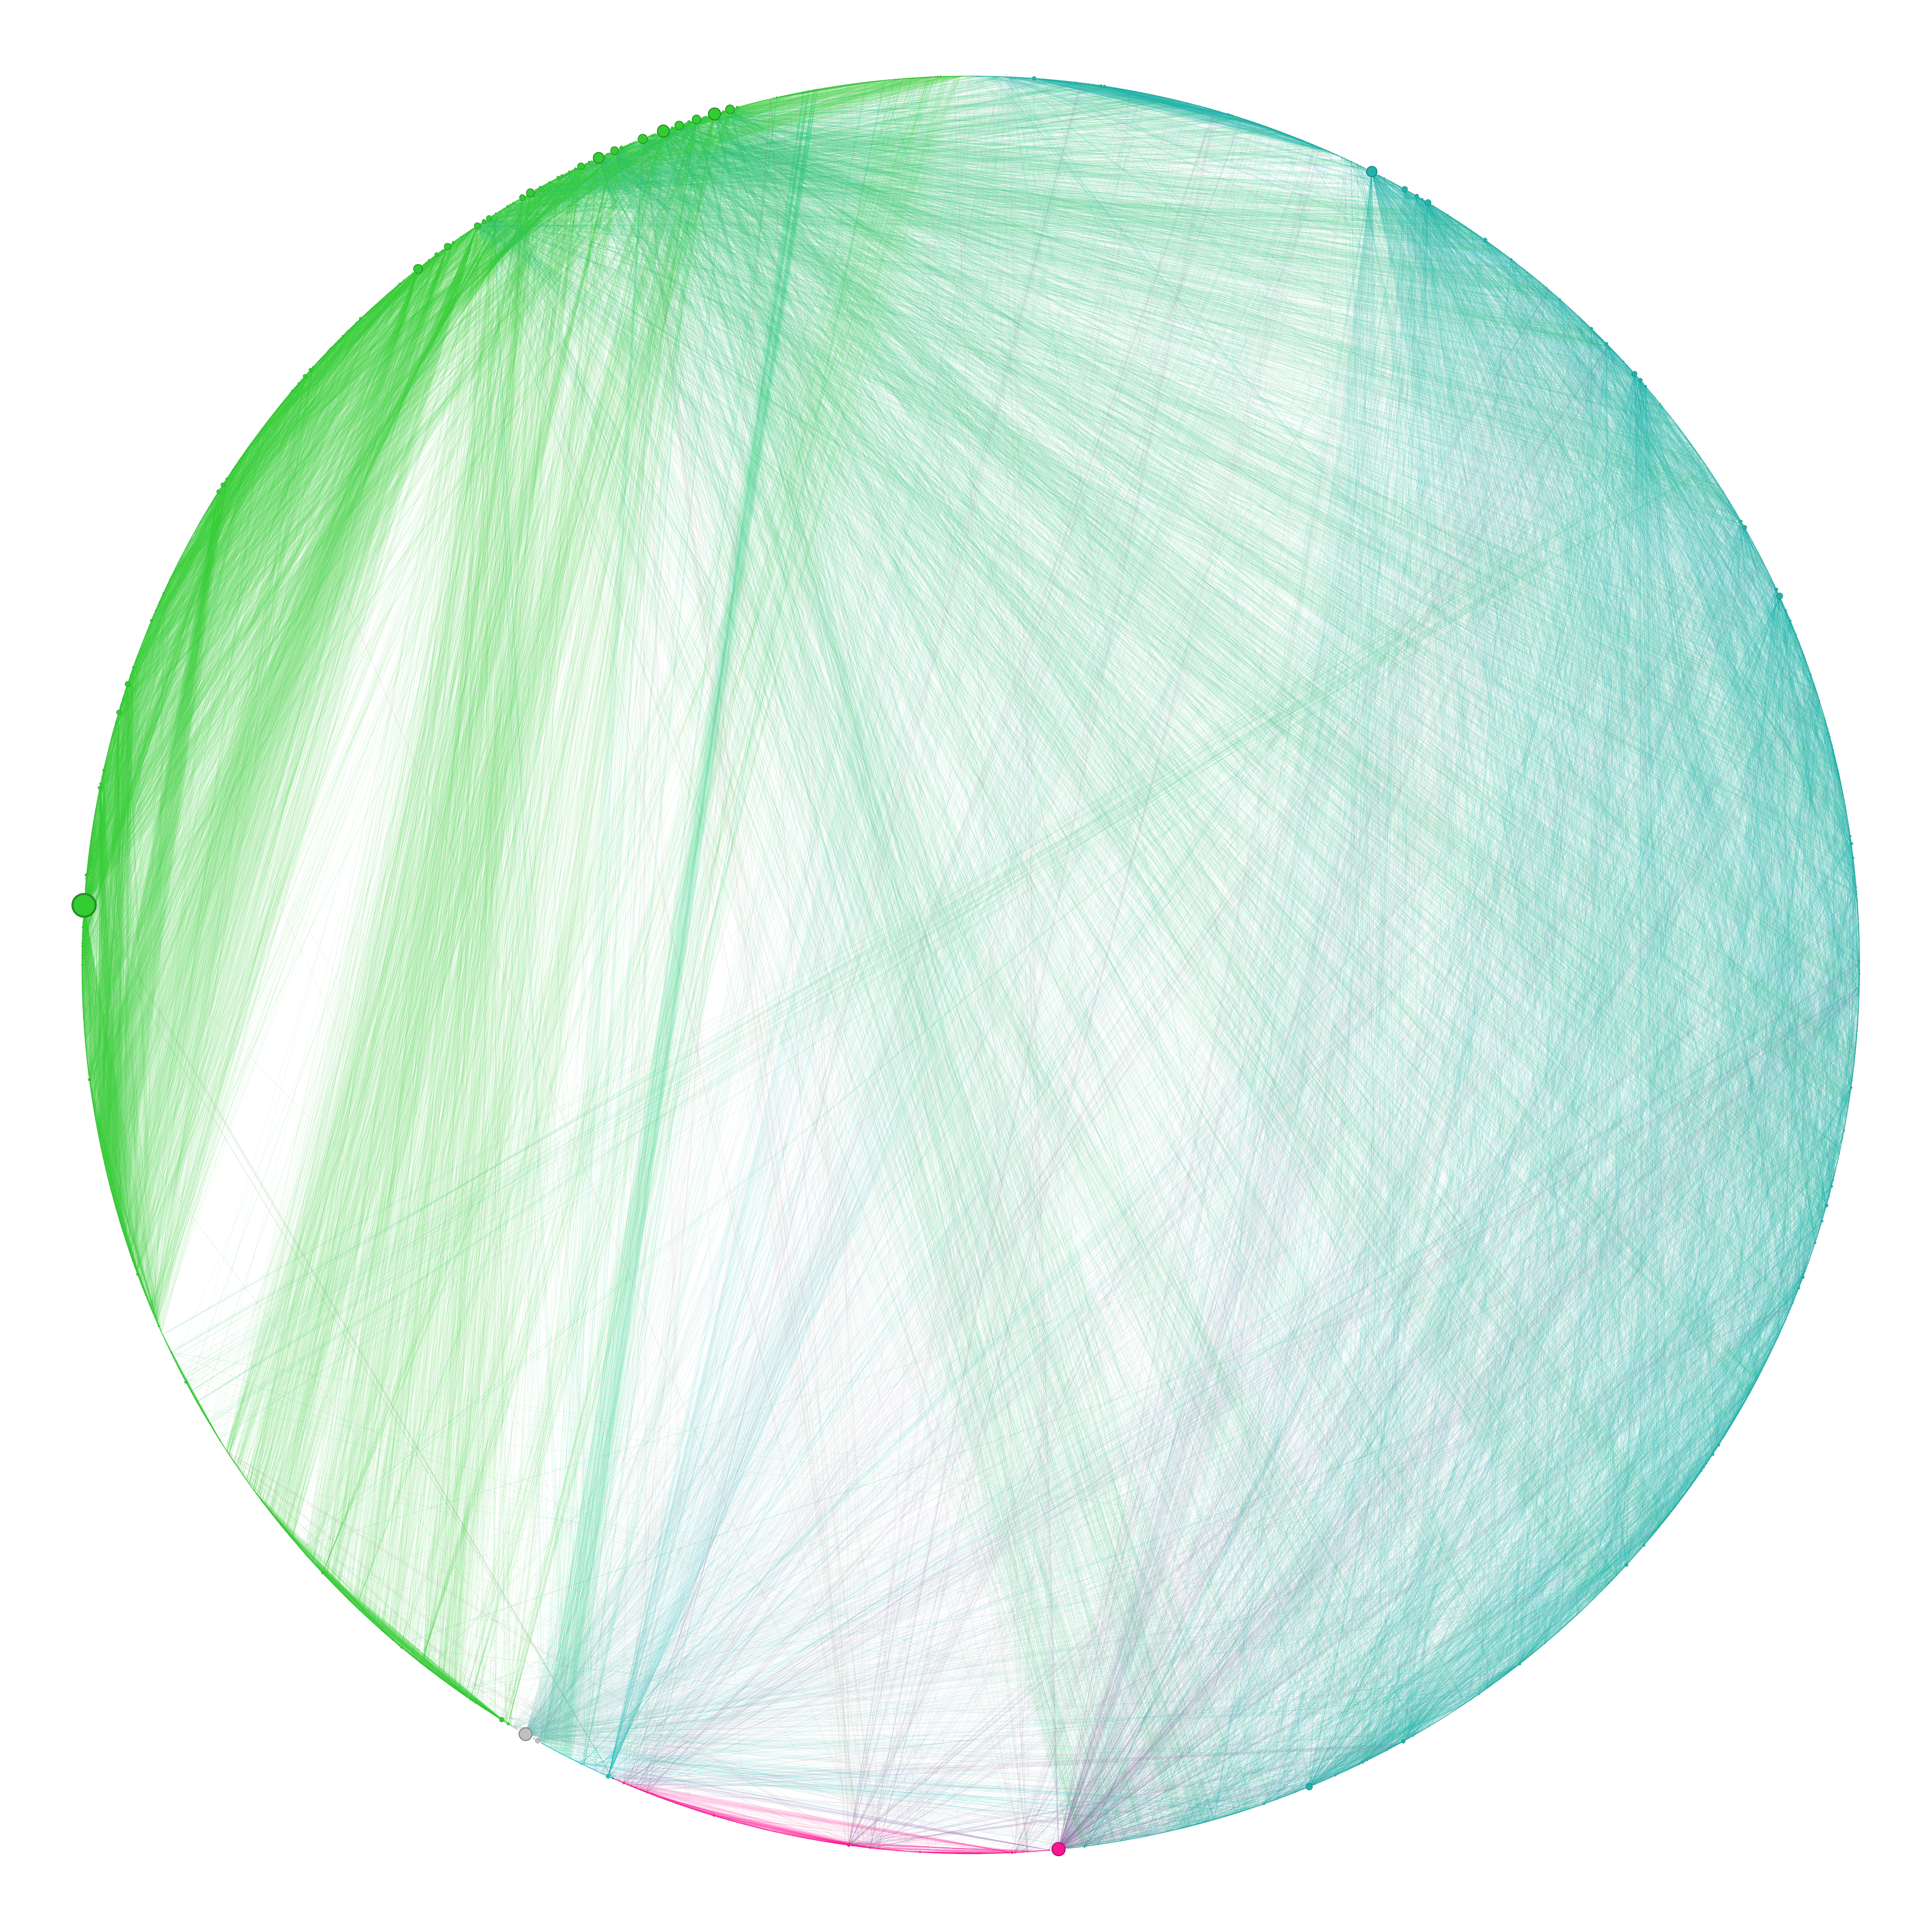
Circular layout

Circular layout in this case doesn’t provide much more information, although from the edge colors we can see the overall contribution of build, testing and third_party components in the base translation units.
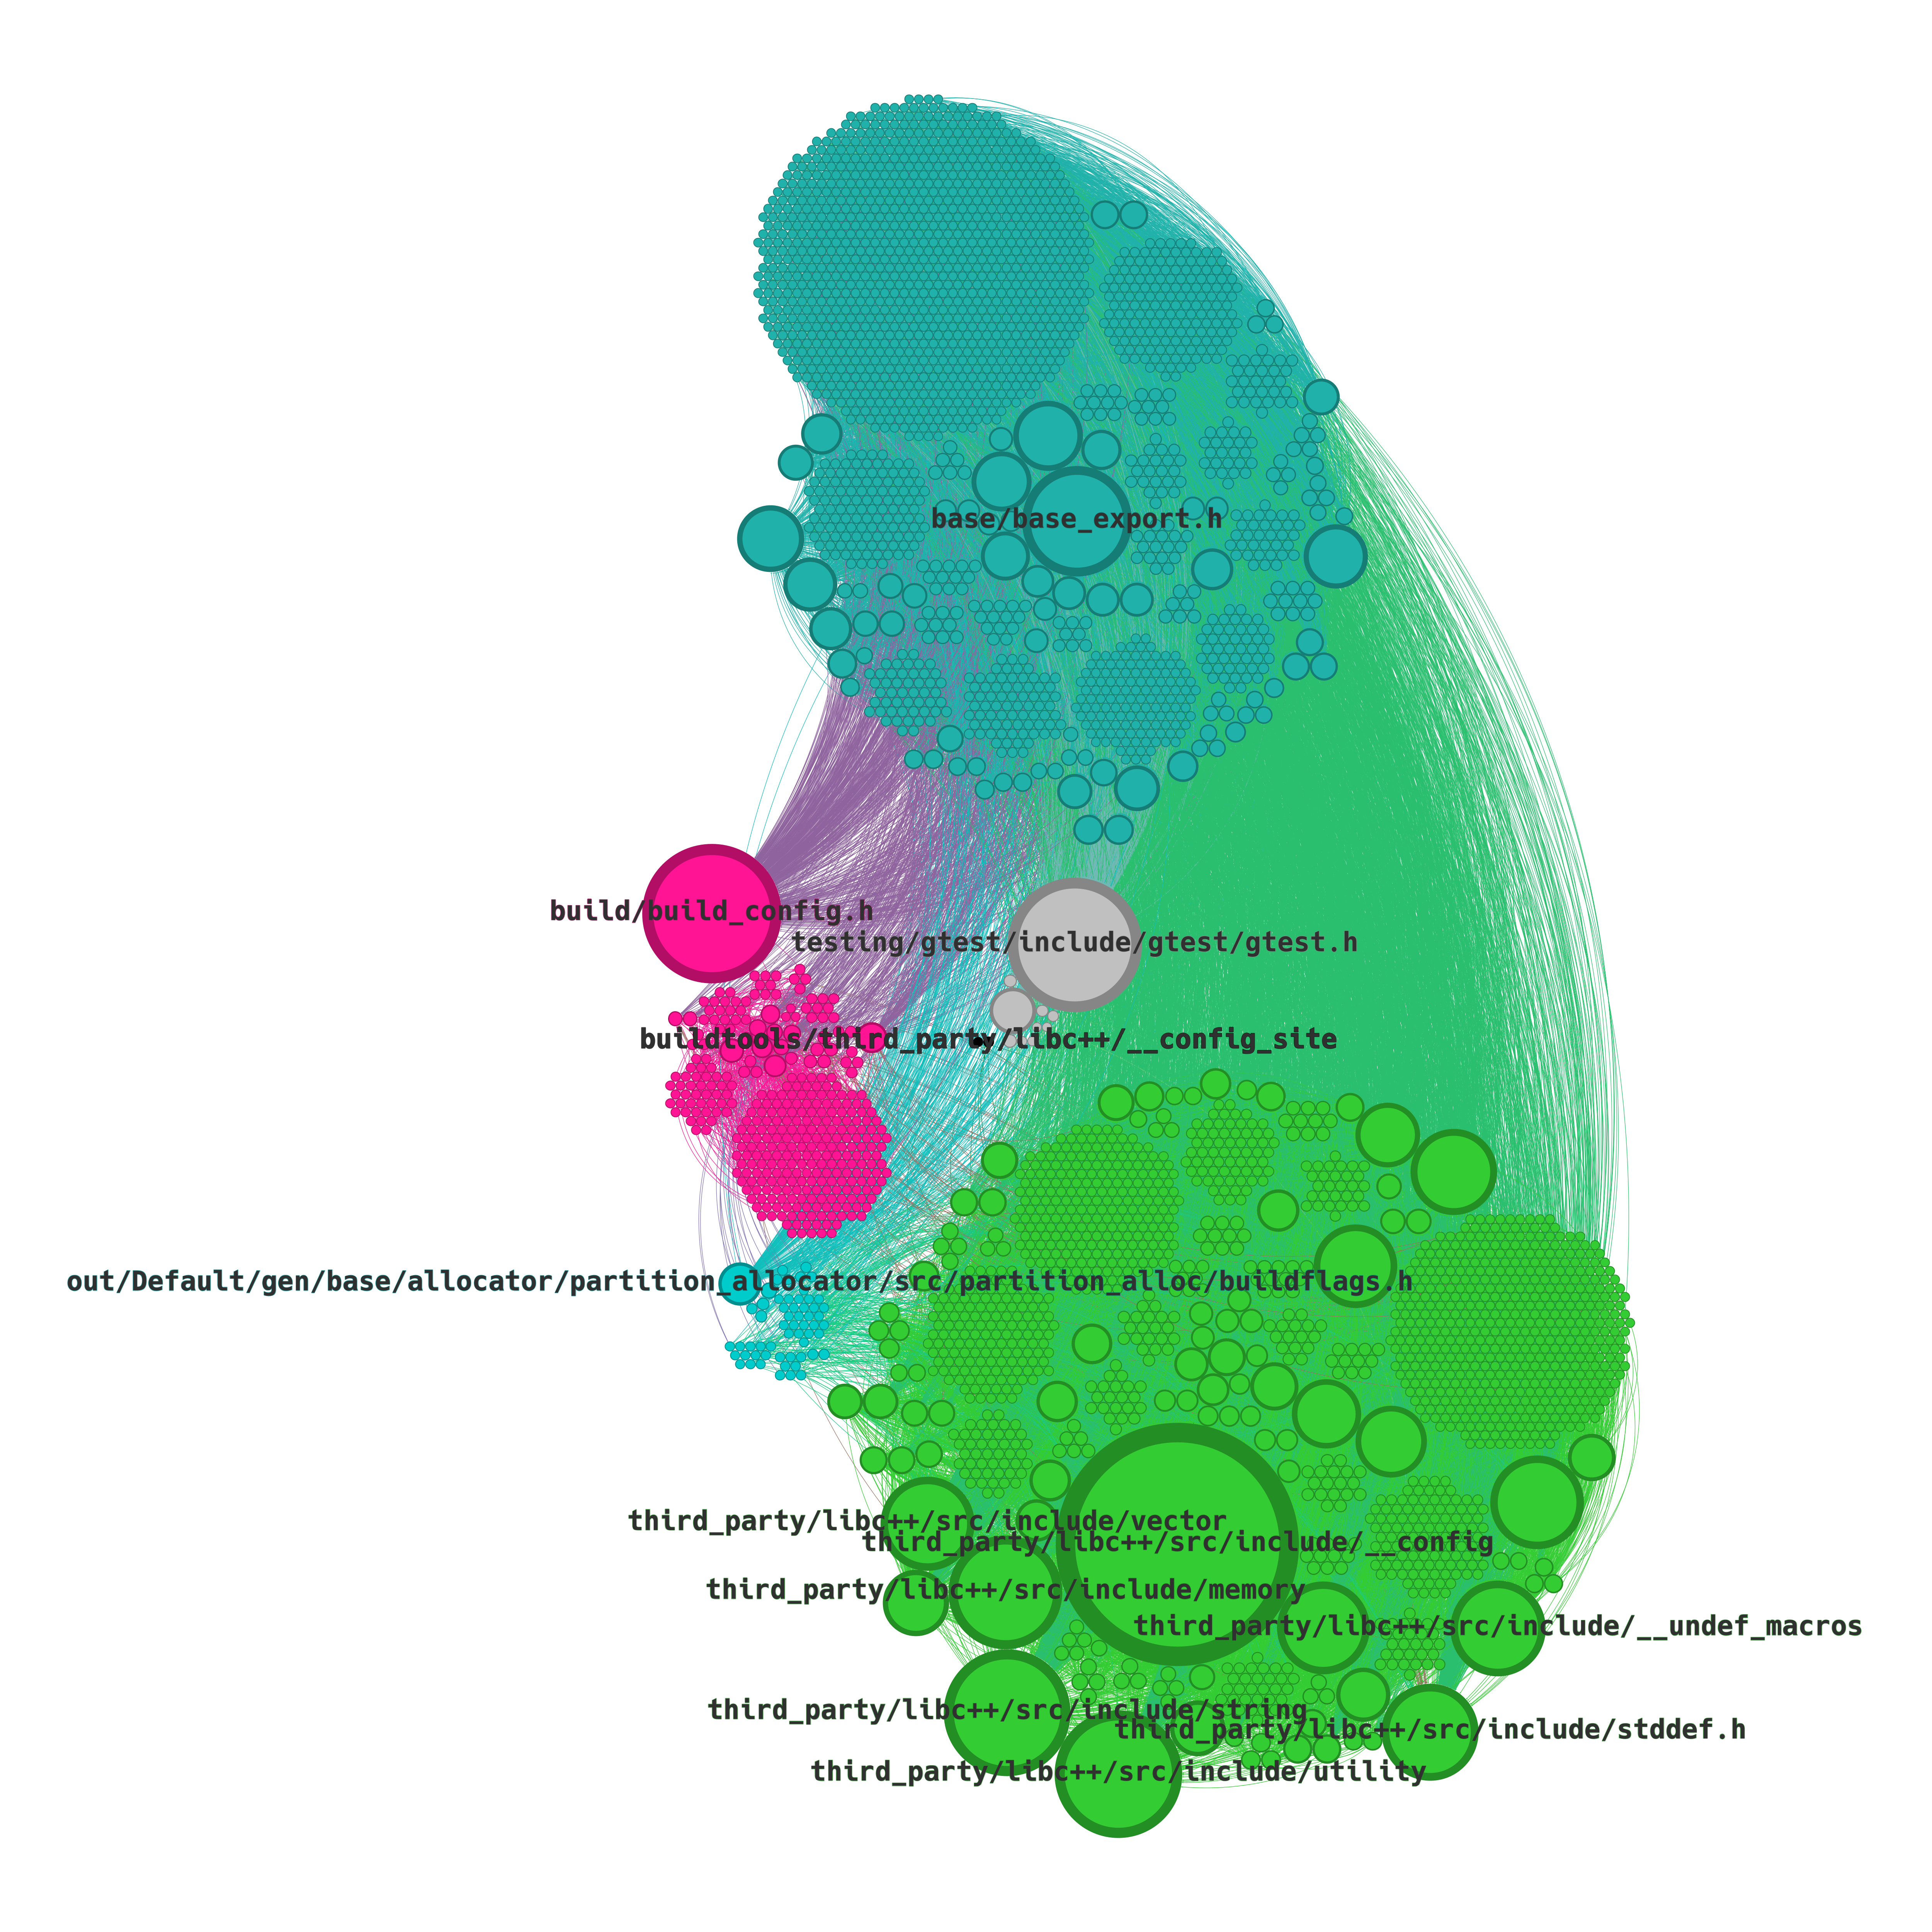
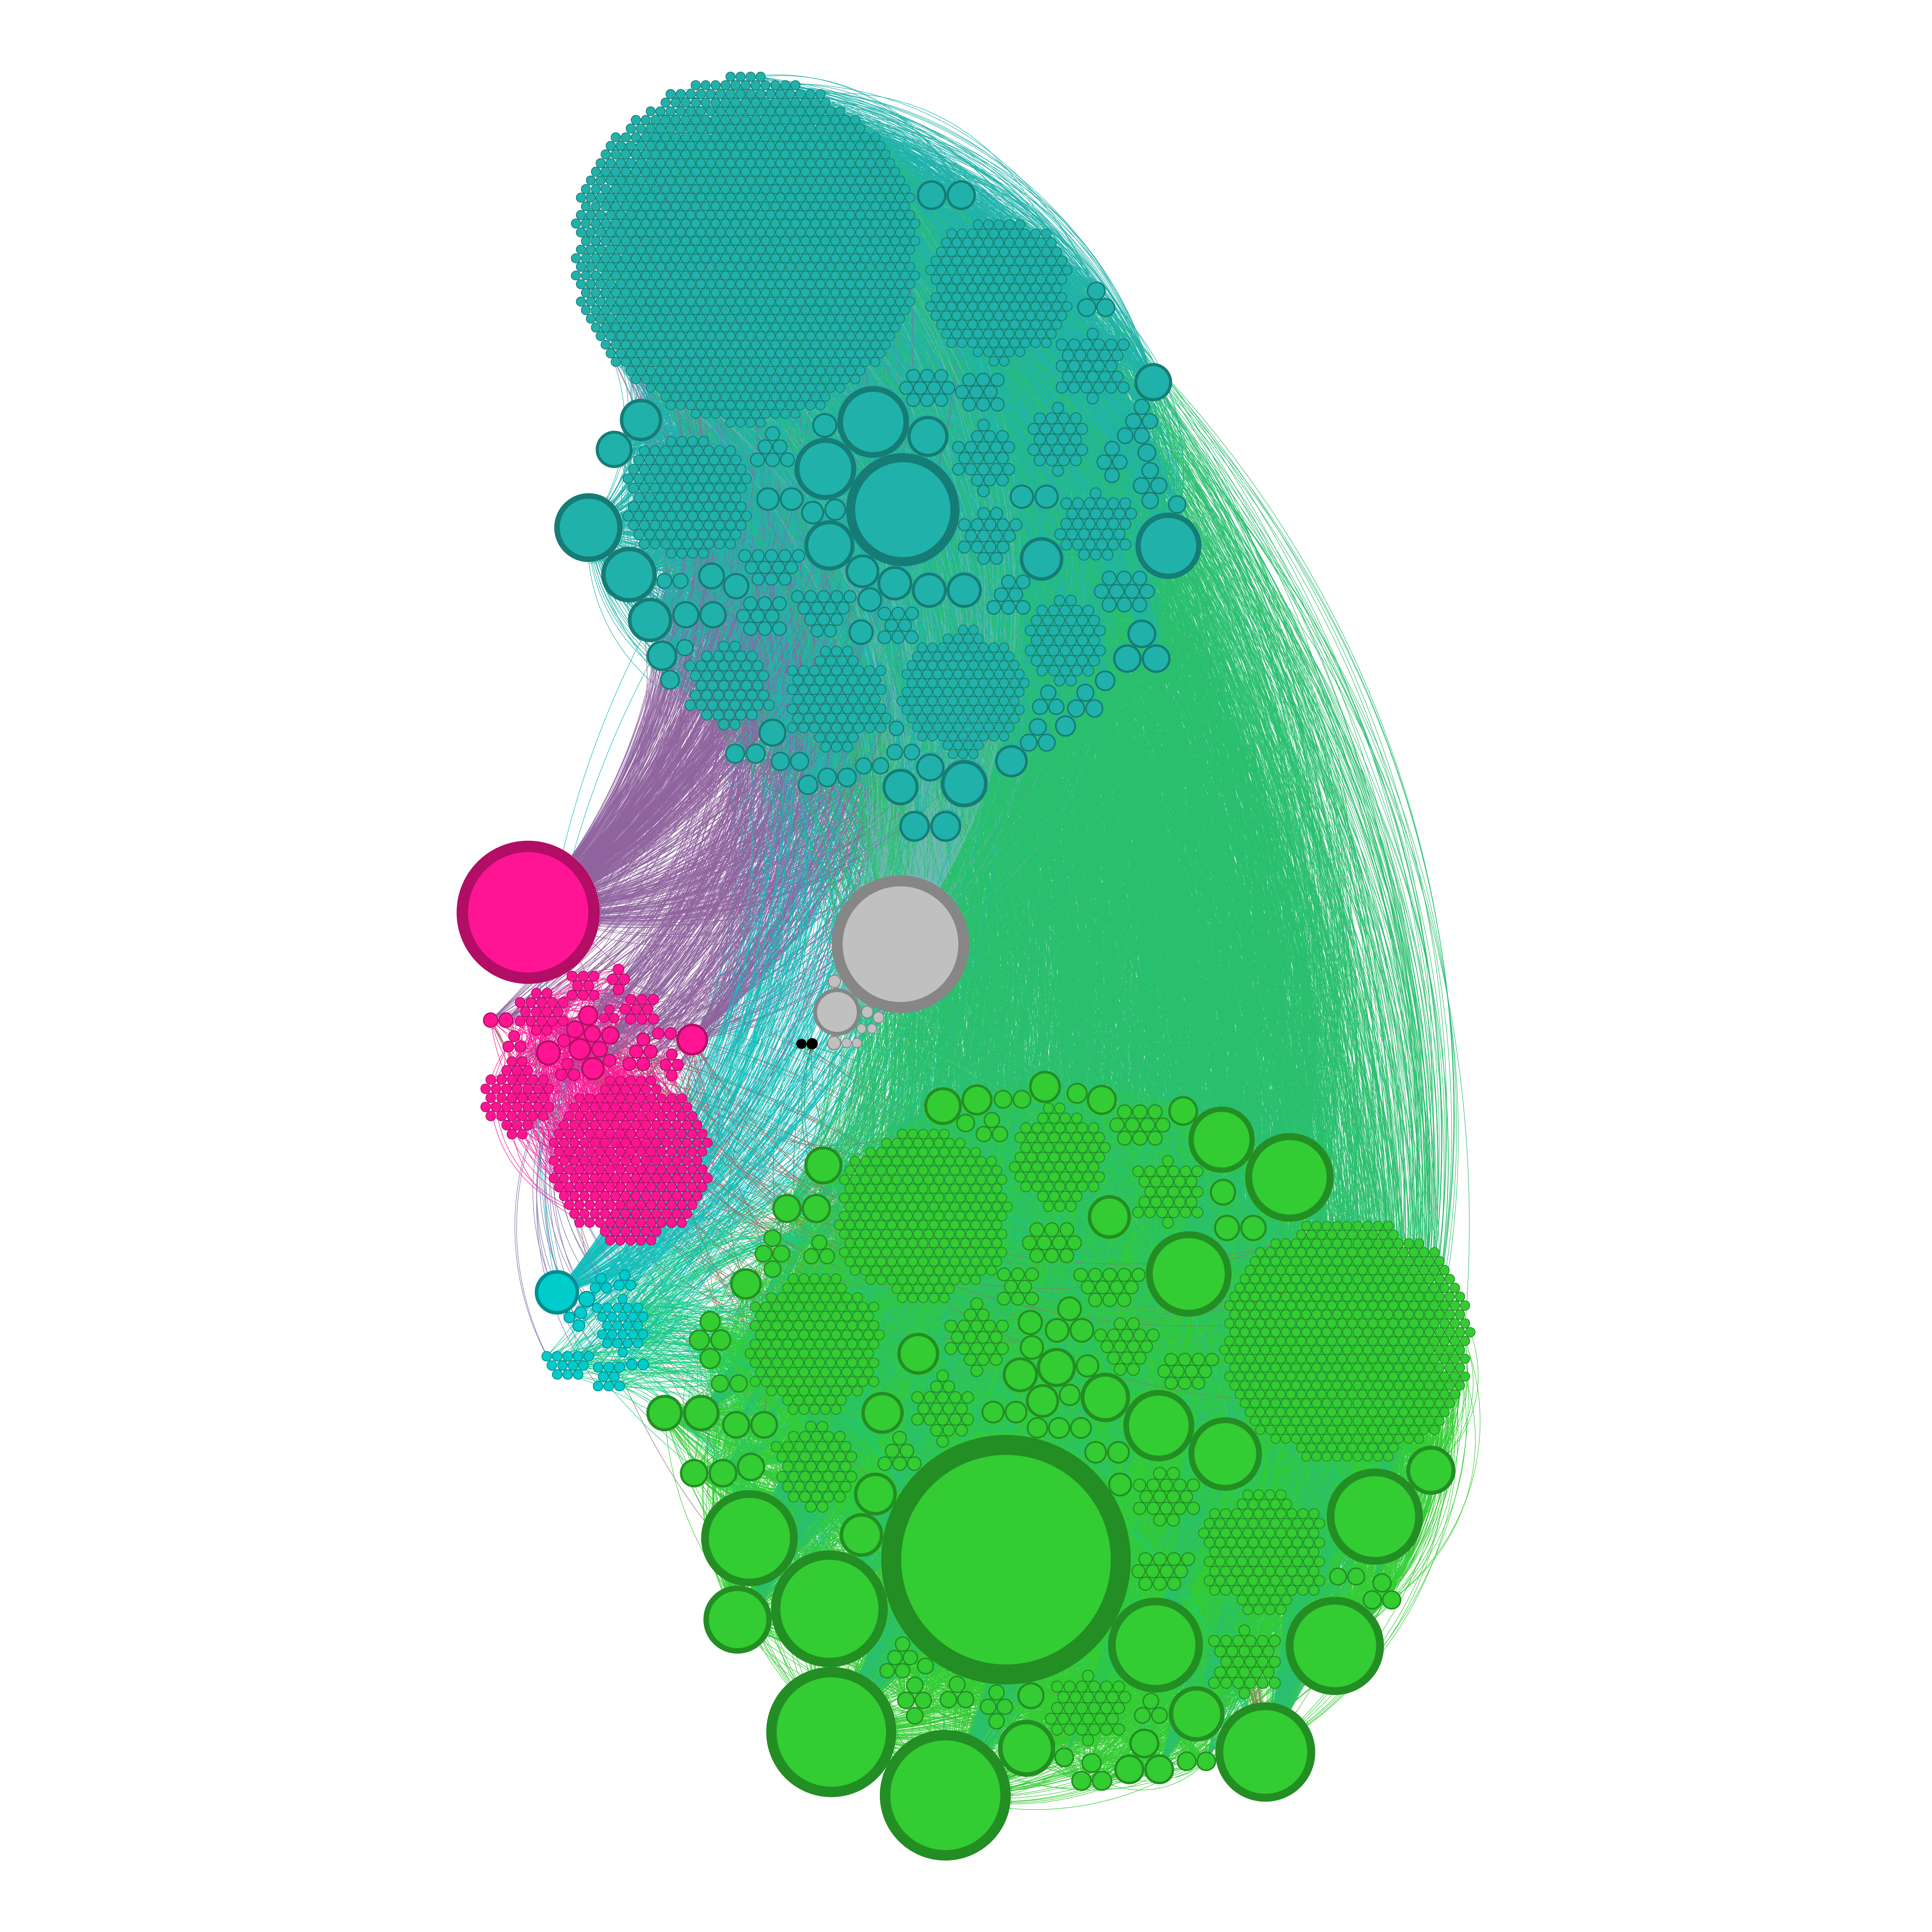
Circular pack layout
Now this diagram, although maybe a little lighter on the eye-candy, probably is the most informative. It clearly shows the number of files (headers or sources) from each component as well as their popularity (node radius) within the base translation units.
net subdirectory
Let’s move on to the another subdirectory - net. We can generate respective GraphML files as before.
Based on graph statistics it is about 2x bigger than base:
| Nodes | Edges | Dependencies |
|---|---|---|
| 6116 | 55594 | base, build, buildtools, components, crypto, mojo, net, out, sql, testing, third_party, ui, url |
Based on the list of components on which net translation units depend there should be some more colors. Again, we have 3 layouts to choose from:
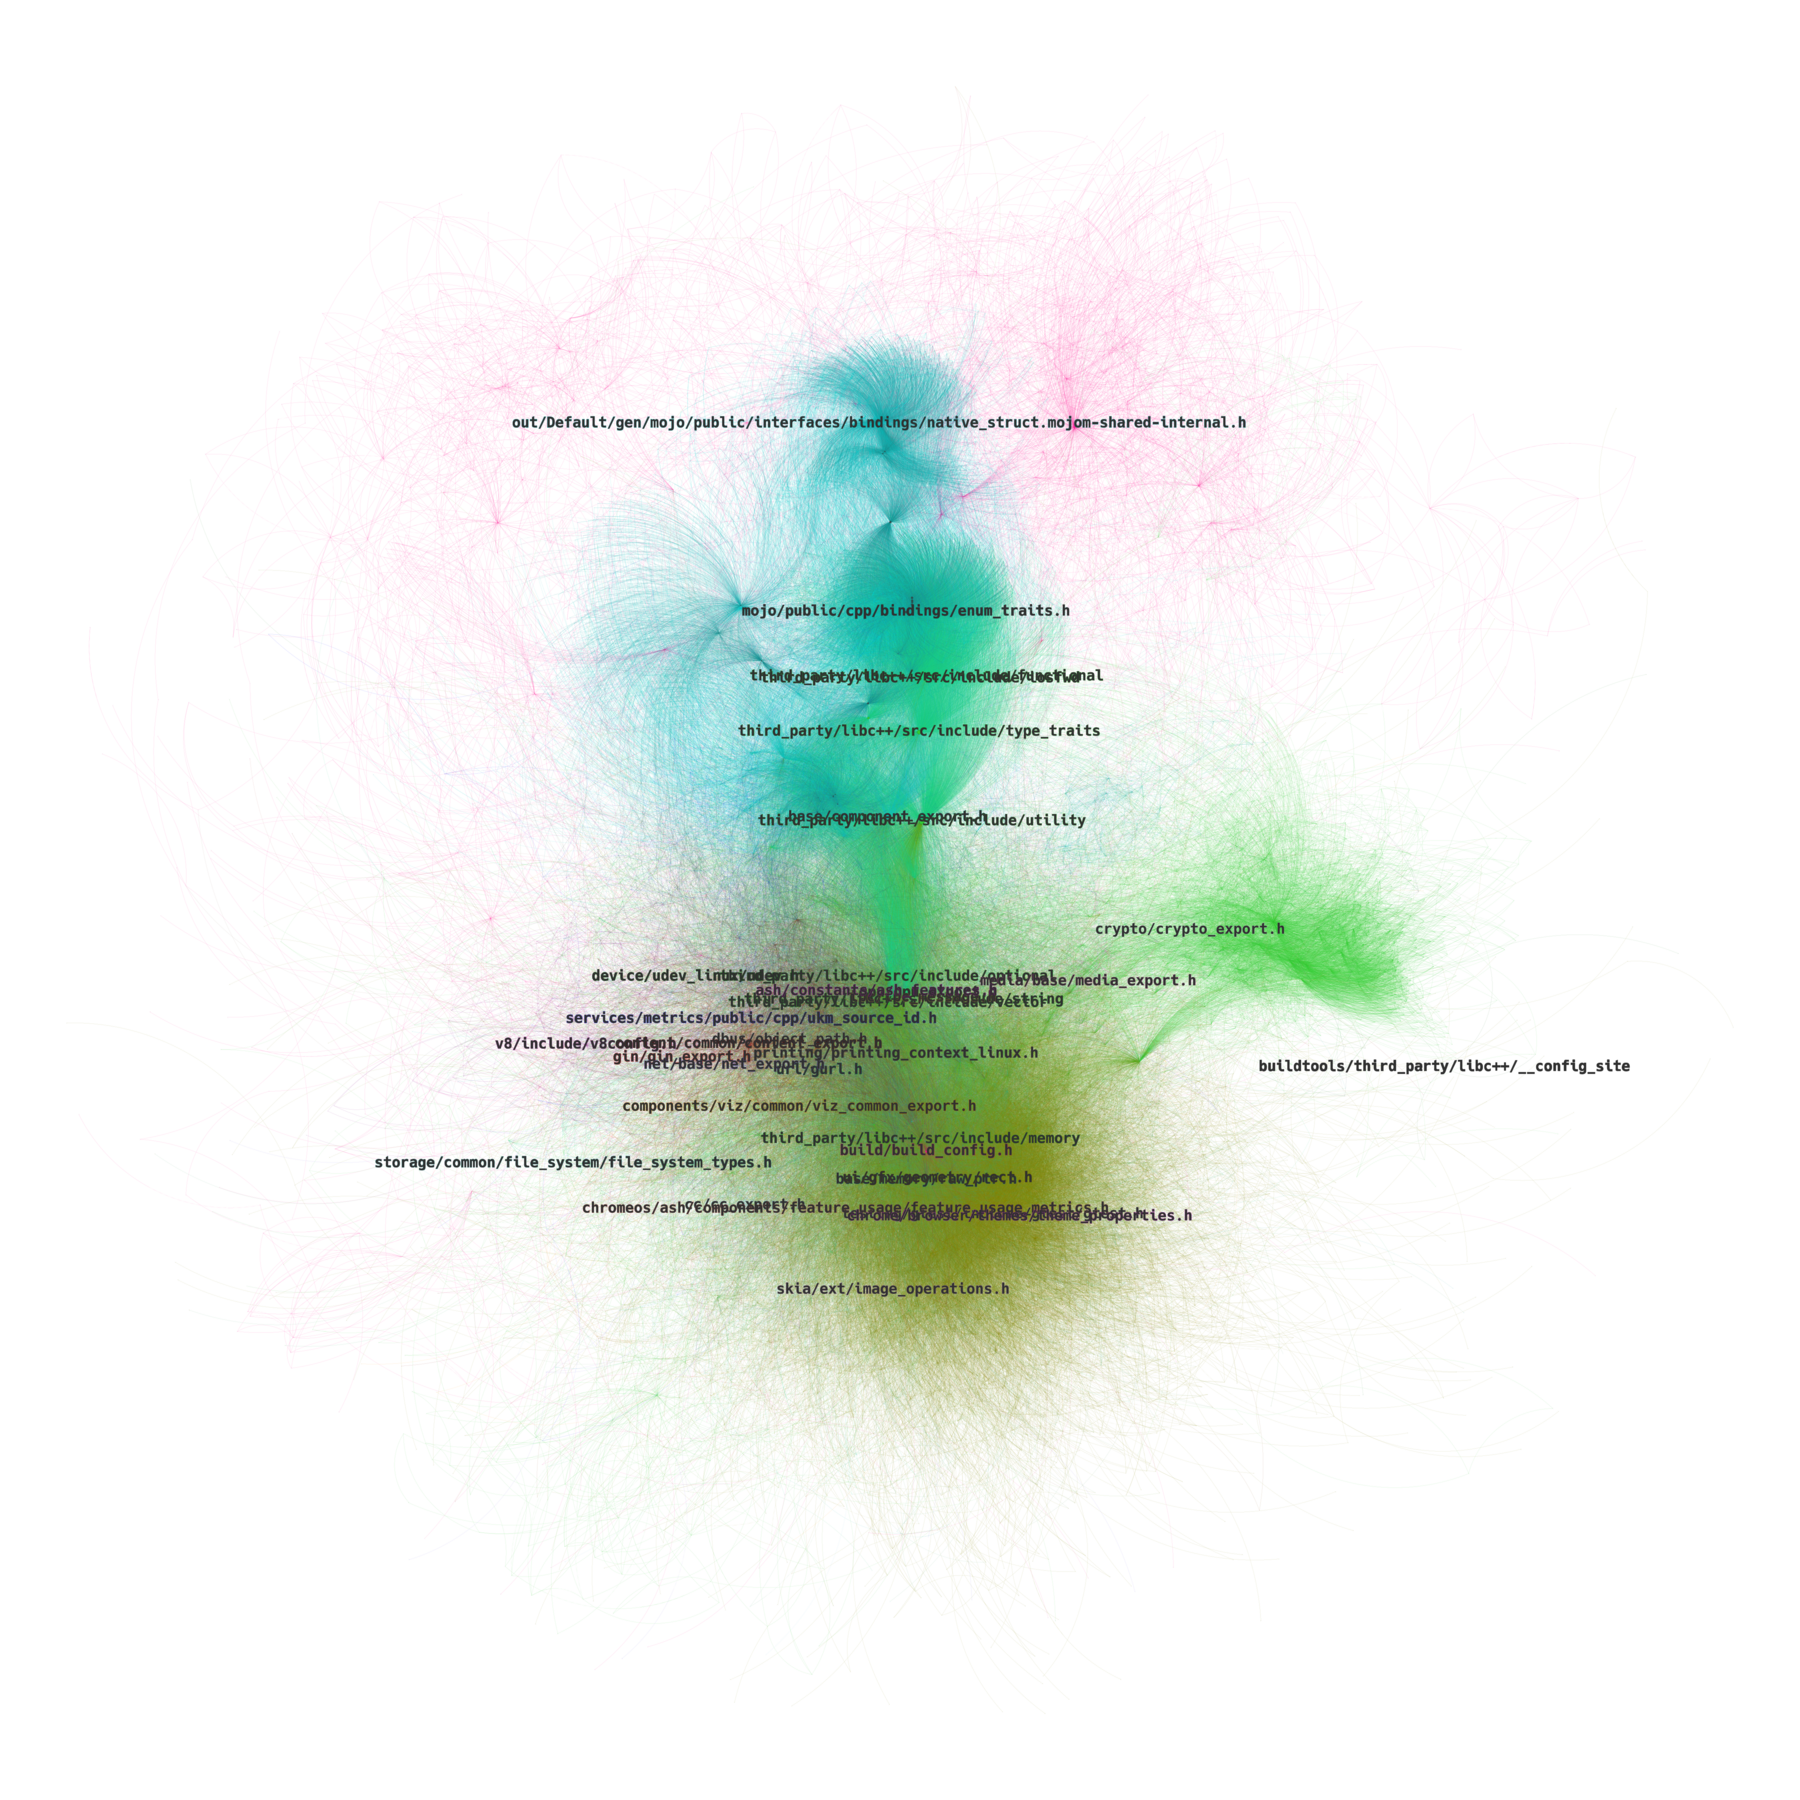
Yifan Hu layout
In case on net subdirectory, we can see that it’s translation units are much less directly dependent on the third_party subdirectory, as most of it forms a separate cluster at the top (note that this graph is doesn’t build on top of the previous one, it’s edges represent include directives discovered by analyzing translation units in net subdirectory). Also, the net headers seem to be tightly coupled into 2 clusters. Also it’s interesting how the build headers are spread on the outer edges of the graph, meaning they are very loosely interconnected.
Circular layout
From this layout, we can tell that in this graph over half of the nodes come from net subdirectory (based on the length of the purple arc) and based on the colors of the inner circle we can tell that net files mostly include other files from net subdirectory with some portion of headers from base and third_party directories and only trace amounts of other components.
Circular pack layout

Again, the circular pack layout provides the most useful feedback. We can clearly see the proportions of how each subdirectory contributes to this graph, as well as which files are most included.
ui subdirectory
Next let’s try the ui folder - here we’re starting to get some more nodes and edges.
| Nodes | Edges | Dependencies |
|---|---|---|
| 13308 | 104296 | ash, base, build, buildtools, cc, chrome, chromeos, components, content, crypto, dbus, device, gin, gpu, ipc, media, mojo, net, out, printing, services, skia, storage, testing, third_party, ui, url, v8 |
Now there are also much more dependencies on different components, meaning more colors!
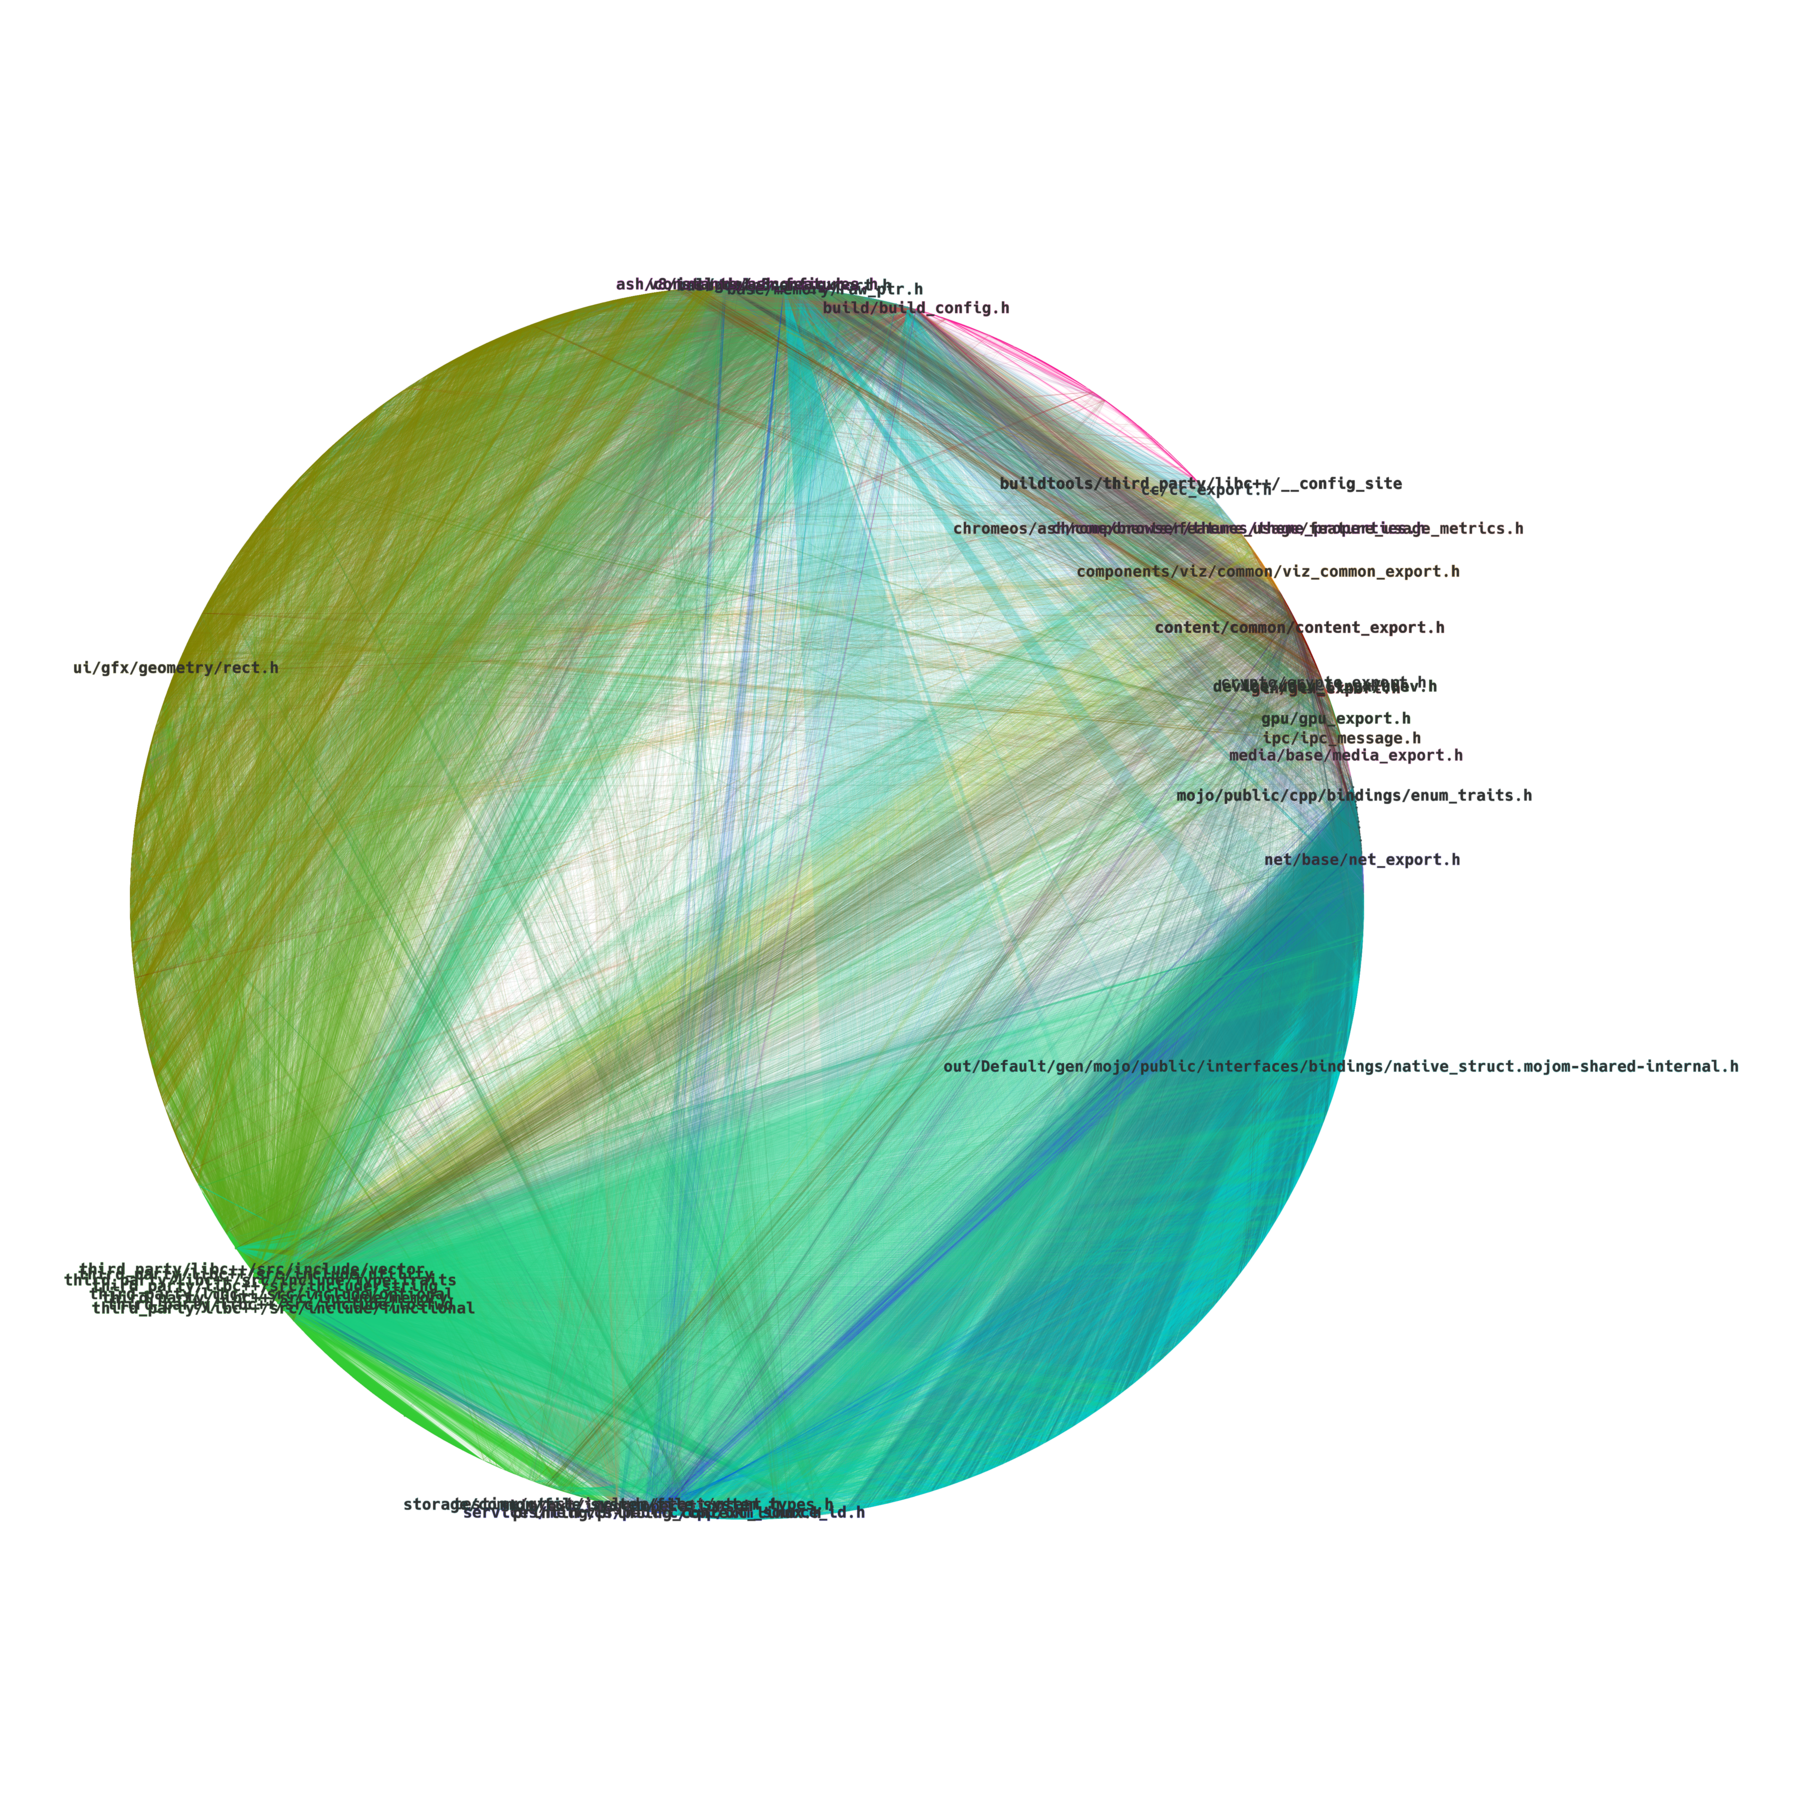
Yifan Hu layout
Here we can see several separate clusters representing ui, third_party and out, with build again dispersed far away from the center cluster.
Circular layout
In case the circular layout starts to get even less informative than the YifanHu layout, however this could be largely due to the color palette selection.
Circular pack layout
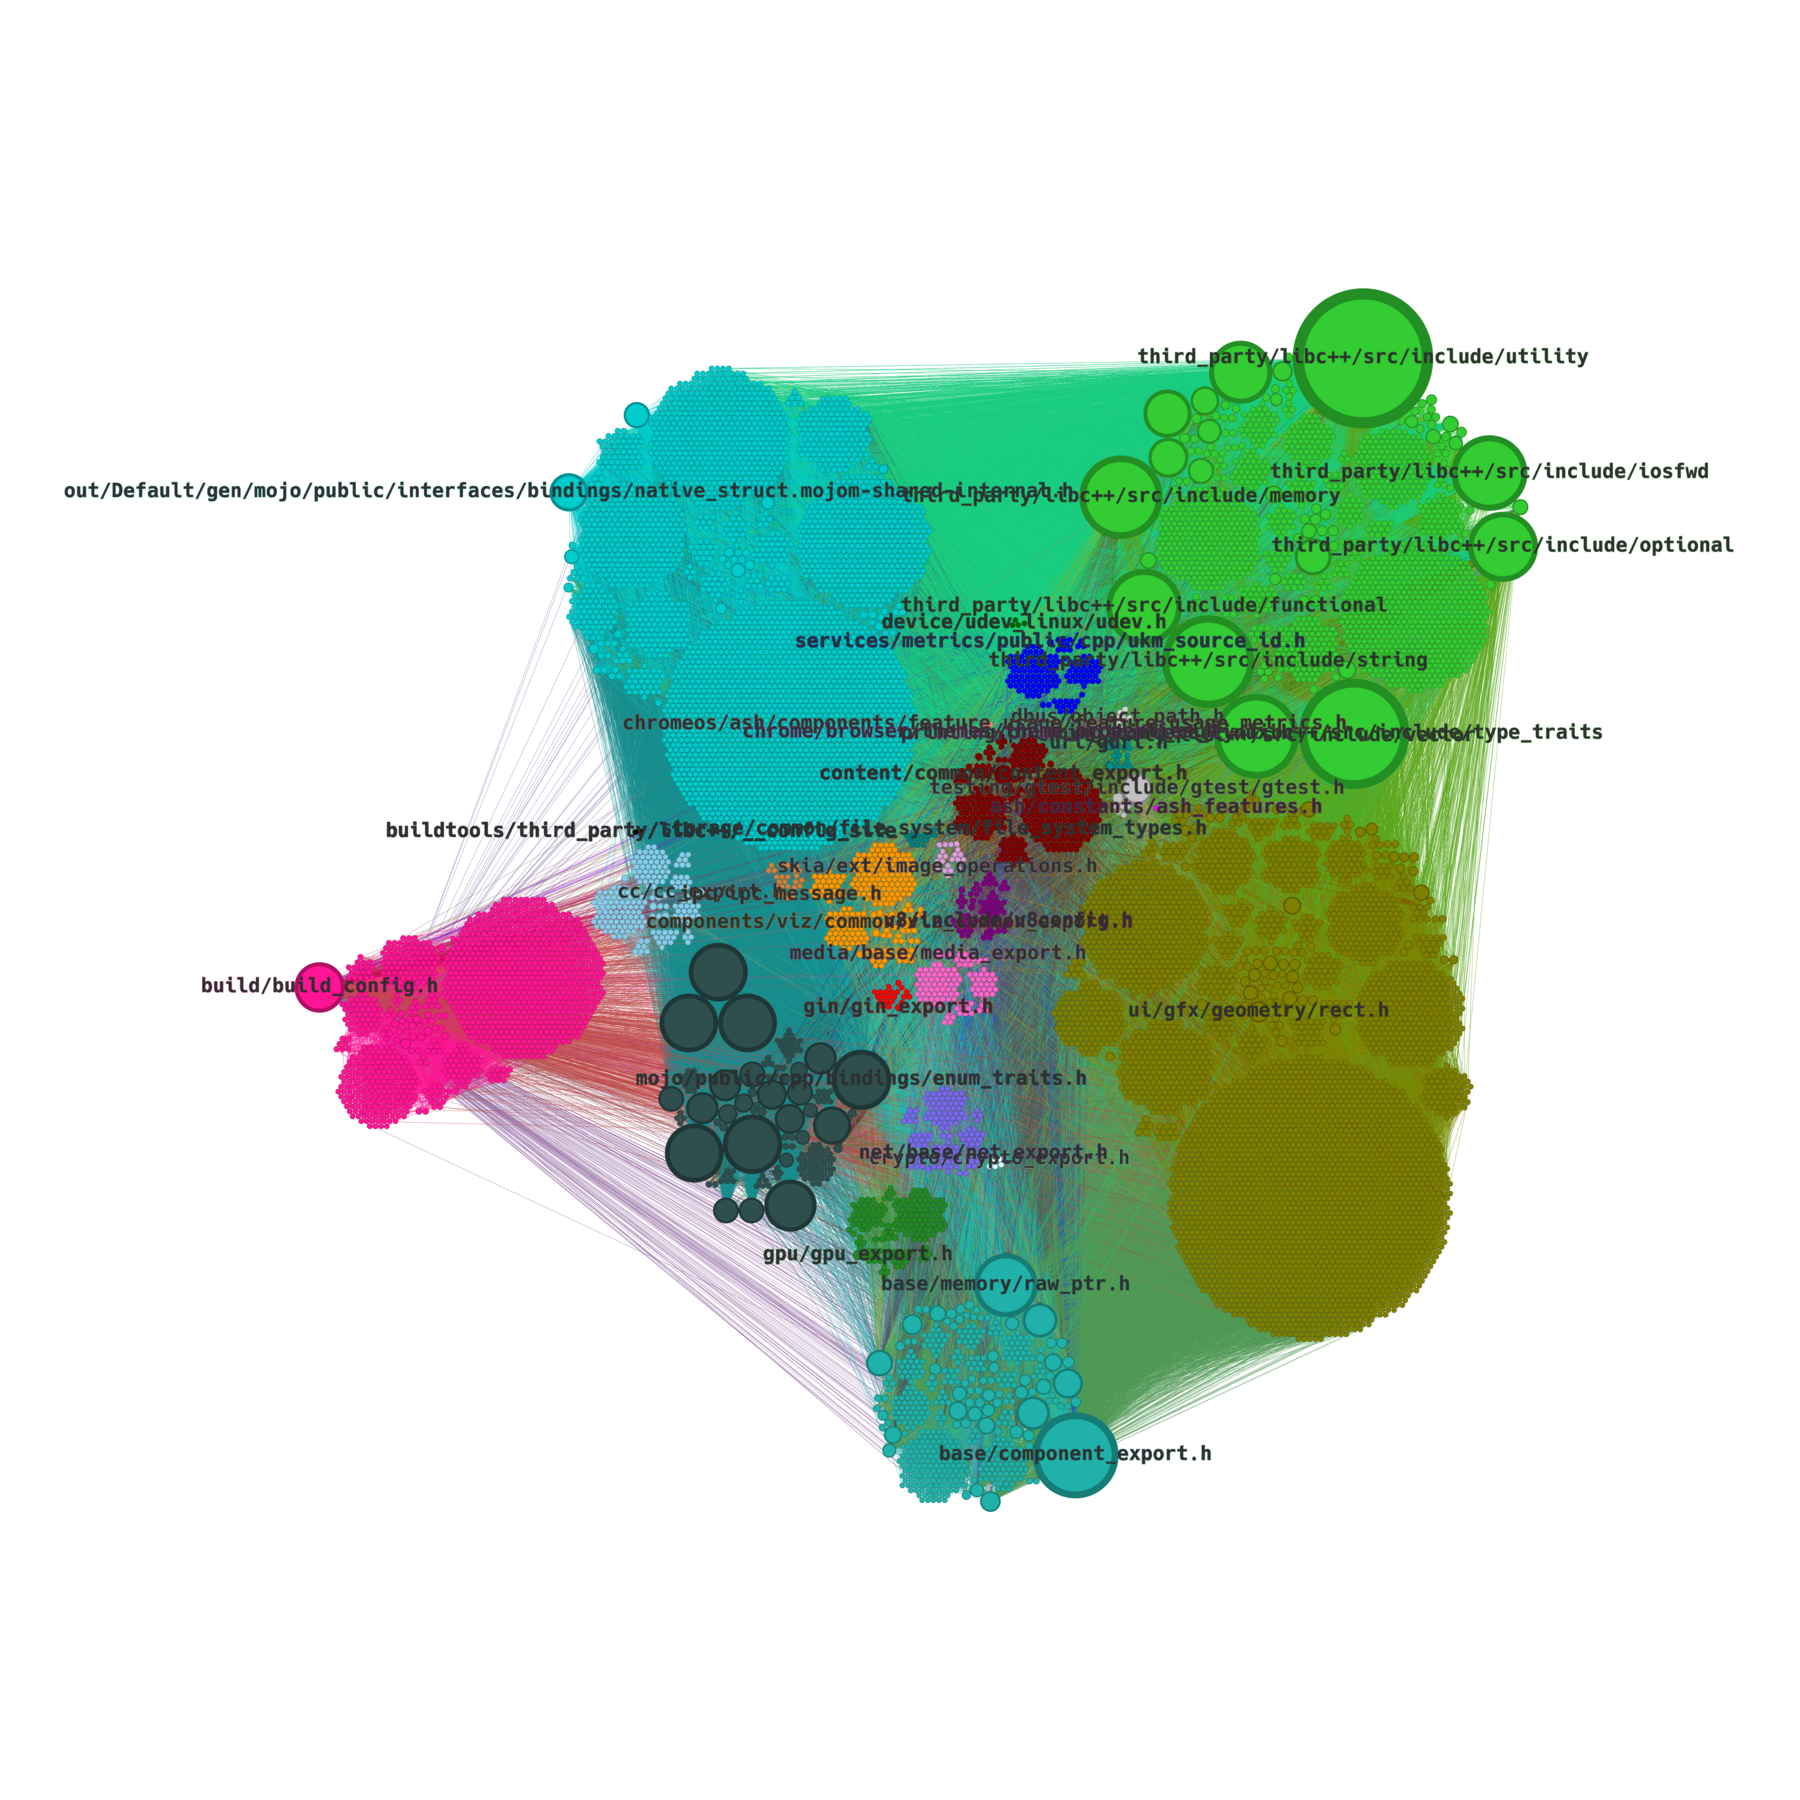
As always the circular pack shows nicely the relative proportions of nodes from respective components and the overall intensity of connections between them.
Also, apparently the most popular shape used by ui translation units is a rectangle.
chrome subdirectory
Let’s try one more before generating complete graph - chrome subdirectory.
| Nodes | Edges | Dependencies |
|---|---|---|
| 36306 | 380188 | apps, ash, base, build, buildtools, cc, chrome, chromeos, components, content, crypto, dbus, device, extensions, gin, google_apis, gpu, ipc, media, mojo, net, out, pdf, ppapi, printing, sandbox, services, skia, sql, storage, testing, third_party, ui, url, v8 |
Yifan Hu layout

Ok, I think we are entering a modern art territory. Here we can see that chrome must be a rather complex component, with significant amount of internal interconnections, depending largely on base, automatically generated code from out and third_party.
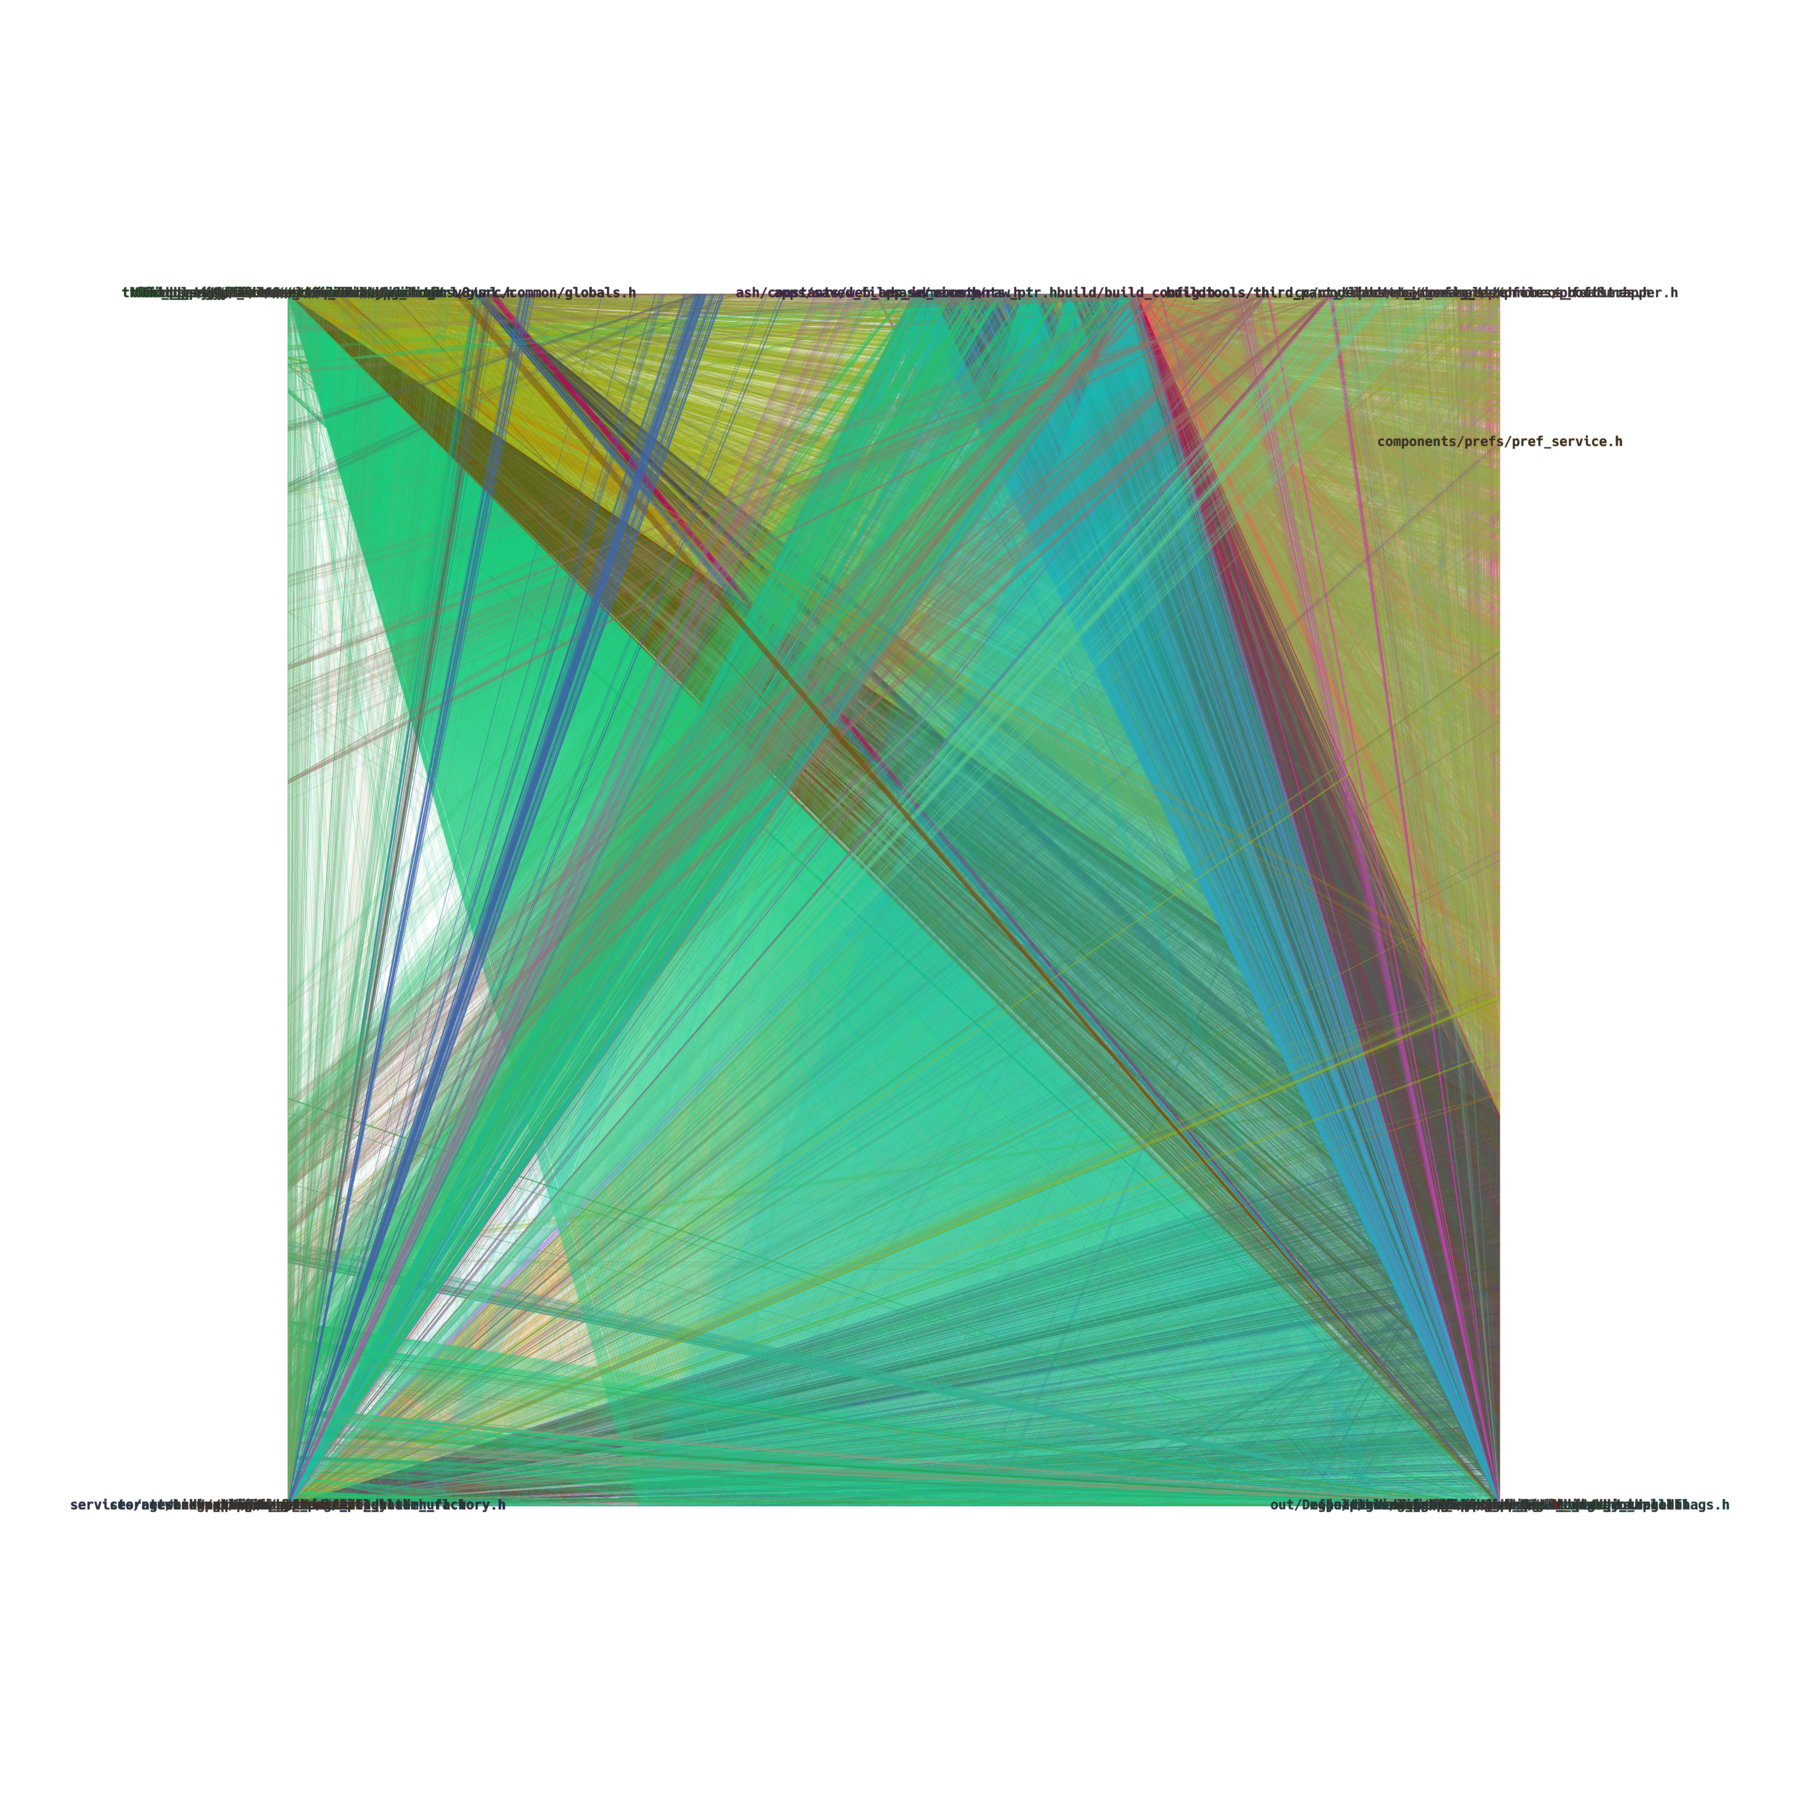
Circular layout
With circular layout we’re starting to hit a canvas limit in Gephi (I don’t actually know if there is a hardcoded limit as such, or is it just Java’s float limit - which is used in Gephi as main coordinate type instead of double).
However, we can still see that a graph generated from chrome subdirectory translation units, consists almost in half of nodes representing sources in that directory (right half of the circle).
Circular pack layout
At this scale, the circular pack nodes start to blur at the reduced resolution as well as edges, but we can at least still tell the overall relative contribution of each component to chrome’s translation units.
The full graph
Ok, this is it. According to the documentation Gephi is rated for up to 1M nodes and 1M edges - our graph has little over 140k nodes and over 1.3M edges, so it can get bumpy.
| Nodes | Edges | Dependencies |
|---|---|---|
| 141248 | 1310551 | apps, ash, base, build, buildtools, cc, chrome, chromeos, codelabs, components, content, crypto, dbus, device, extensions, gin, google_apis, gpu, headless, ipc, media, mojo, net, out, pdf, ppapi, printing, remoting, sandbox, services, skia, sql, storage, testing, third_party, tools, ui, url, v8 |
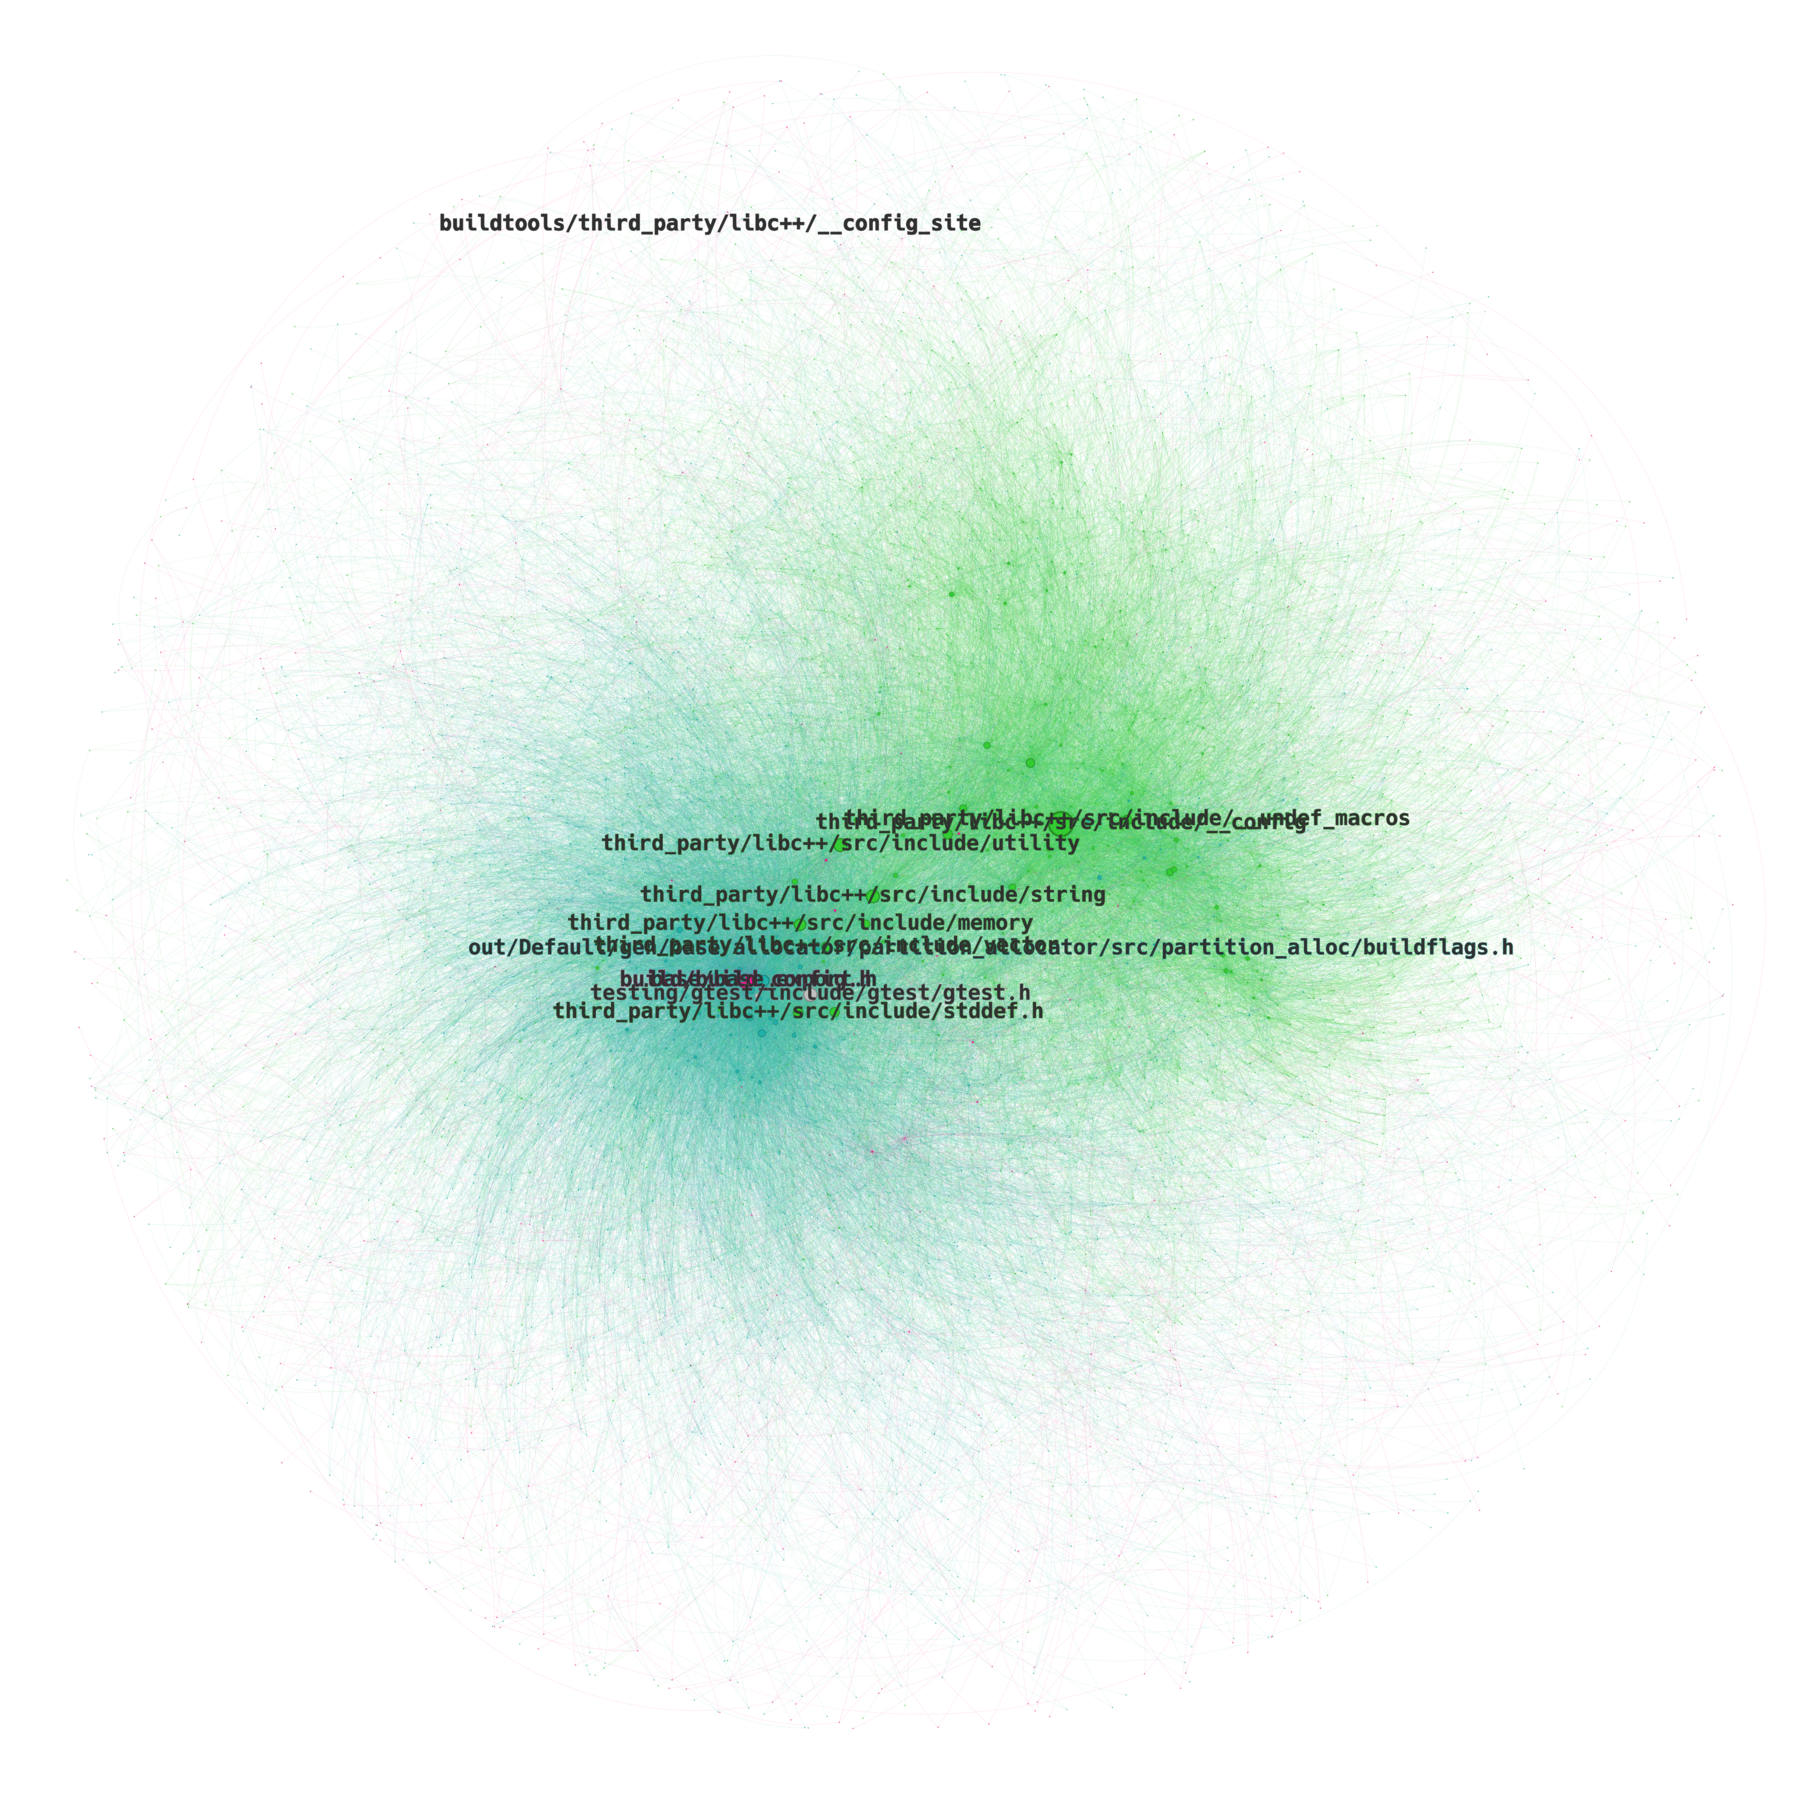
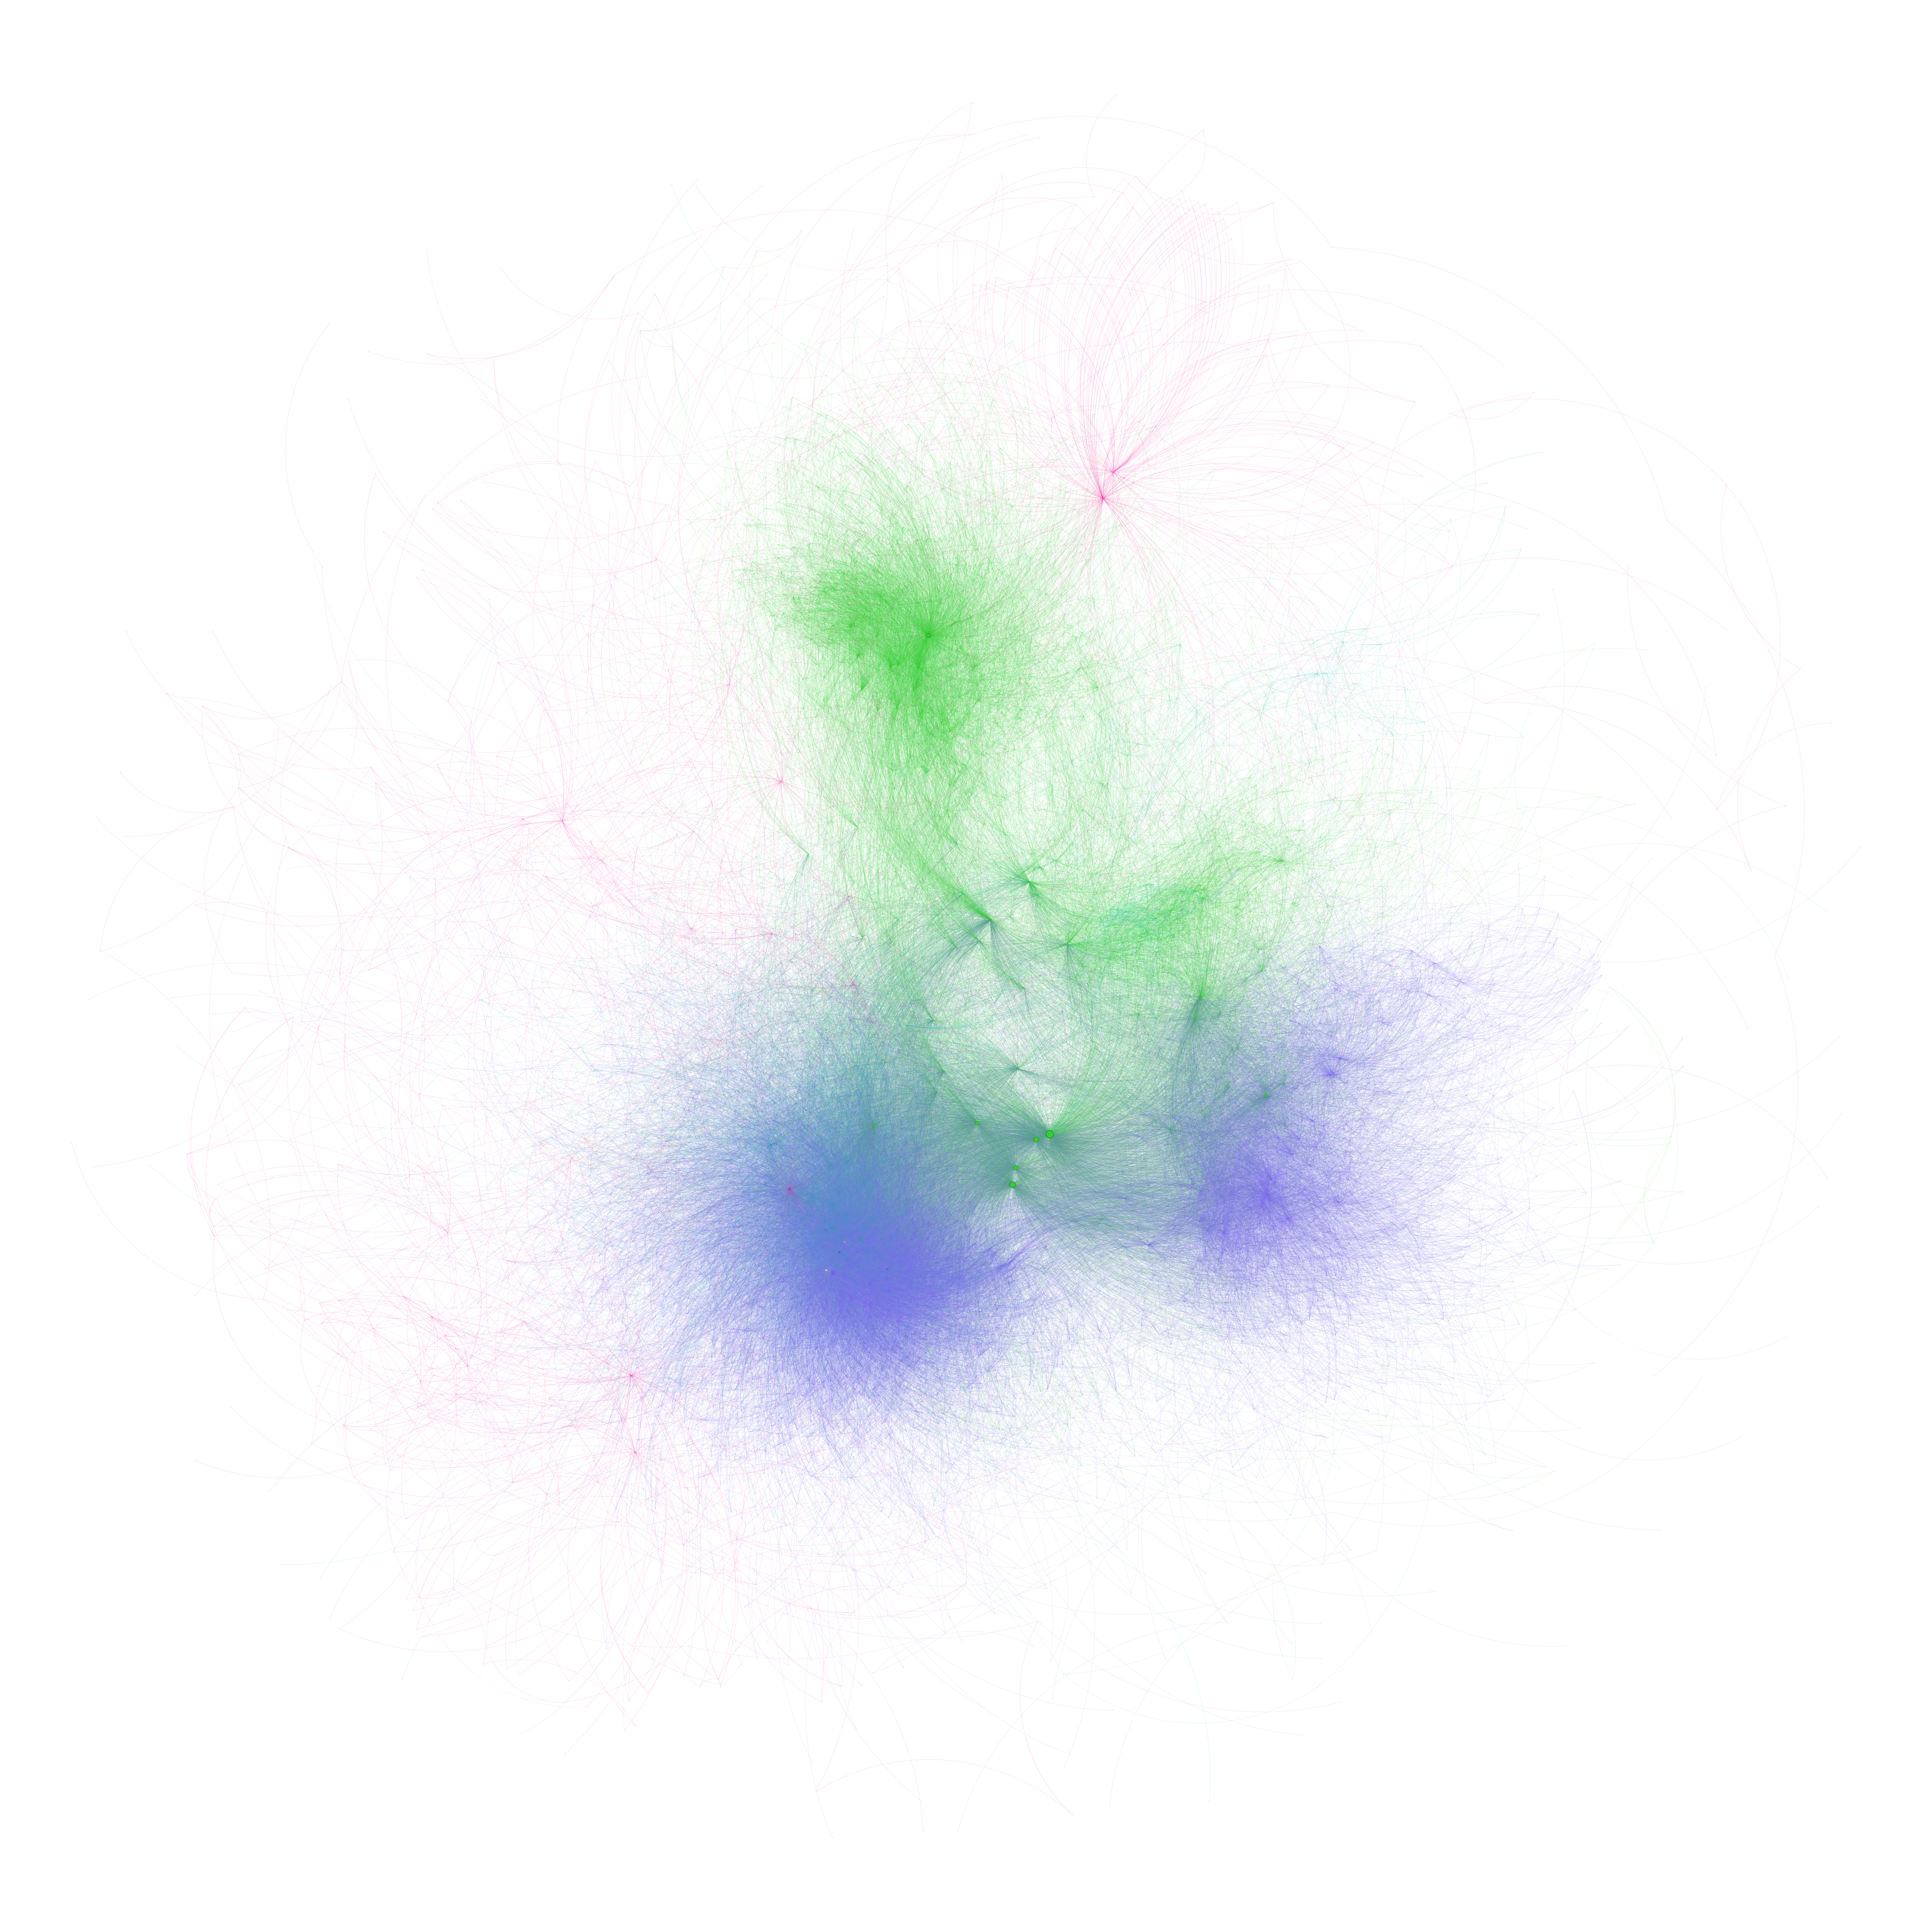
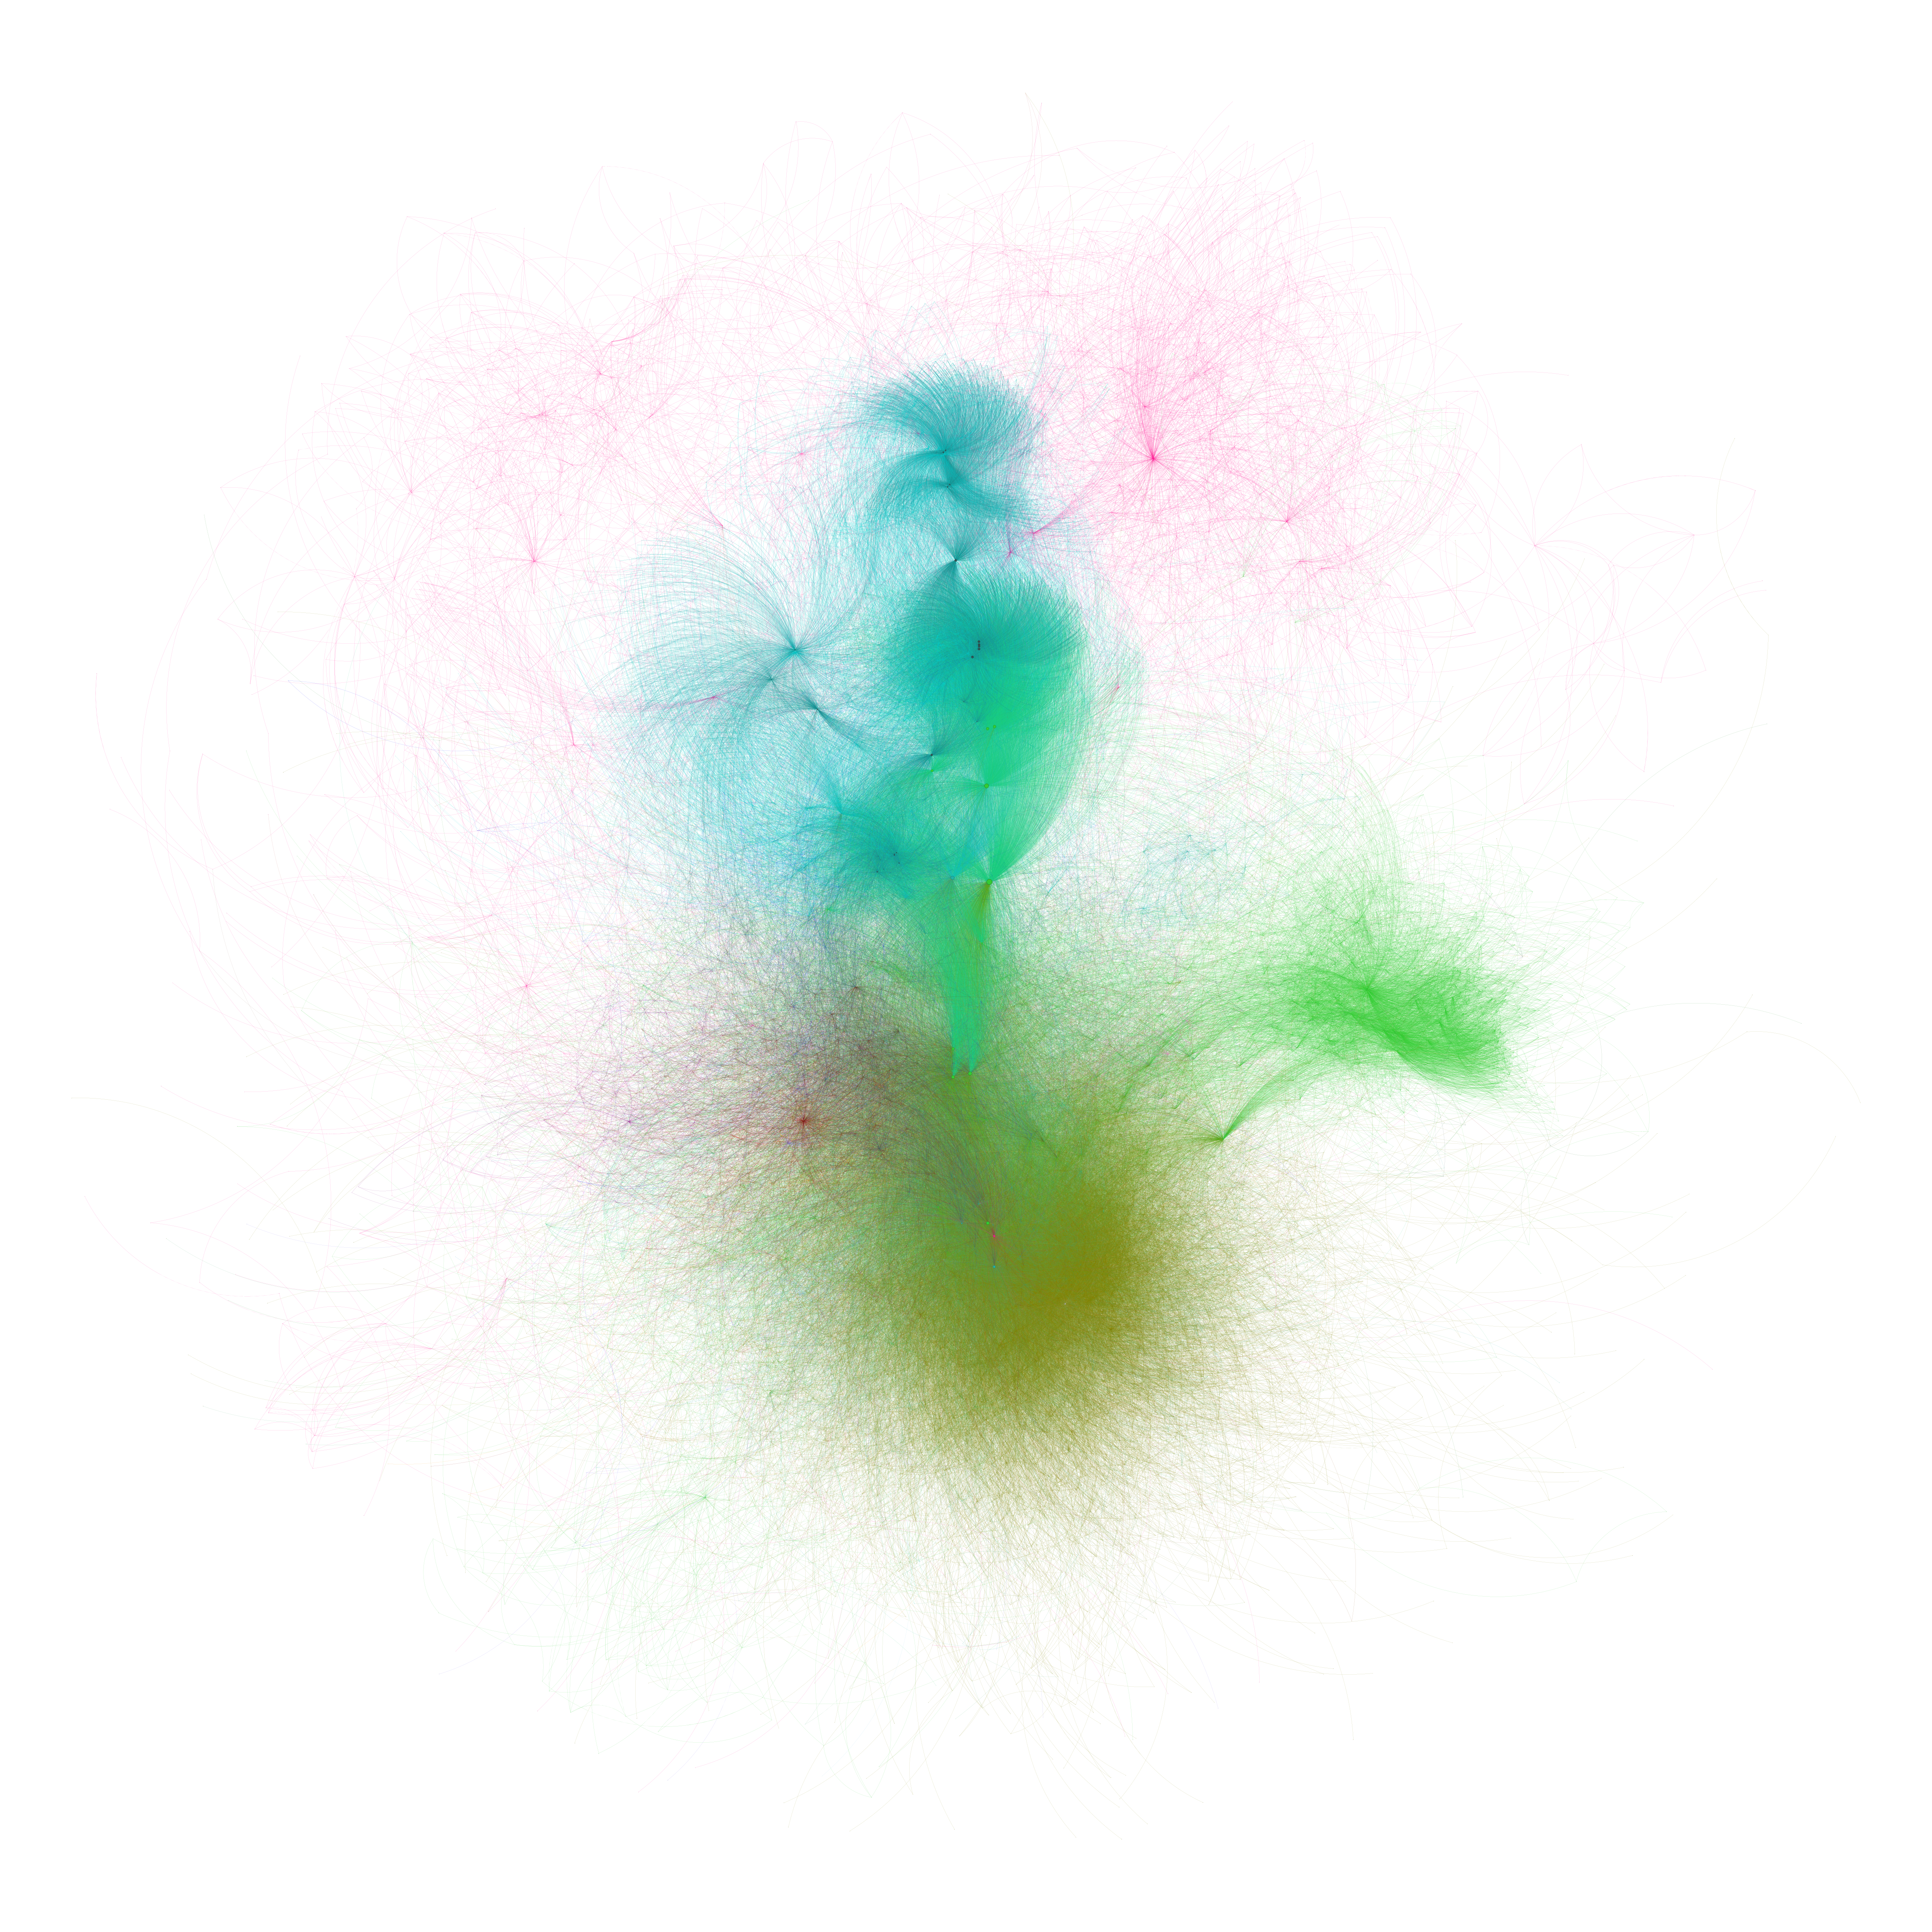
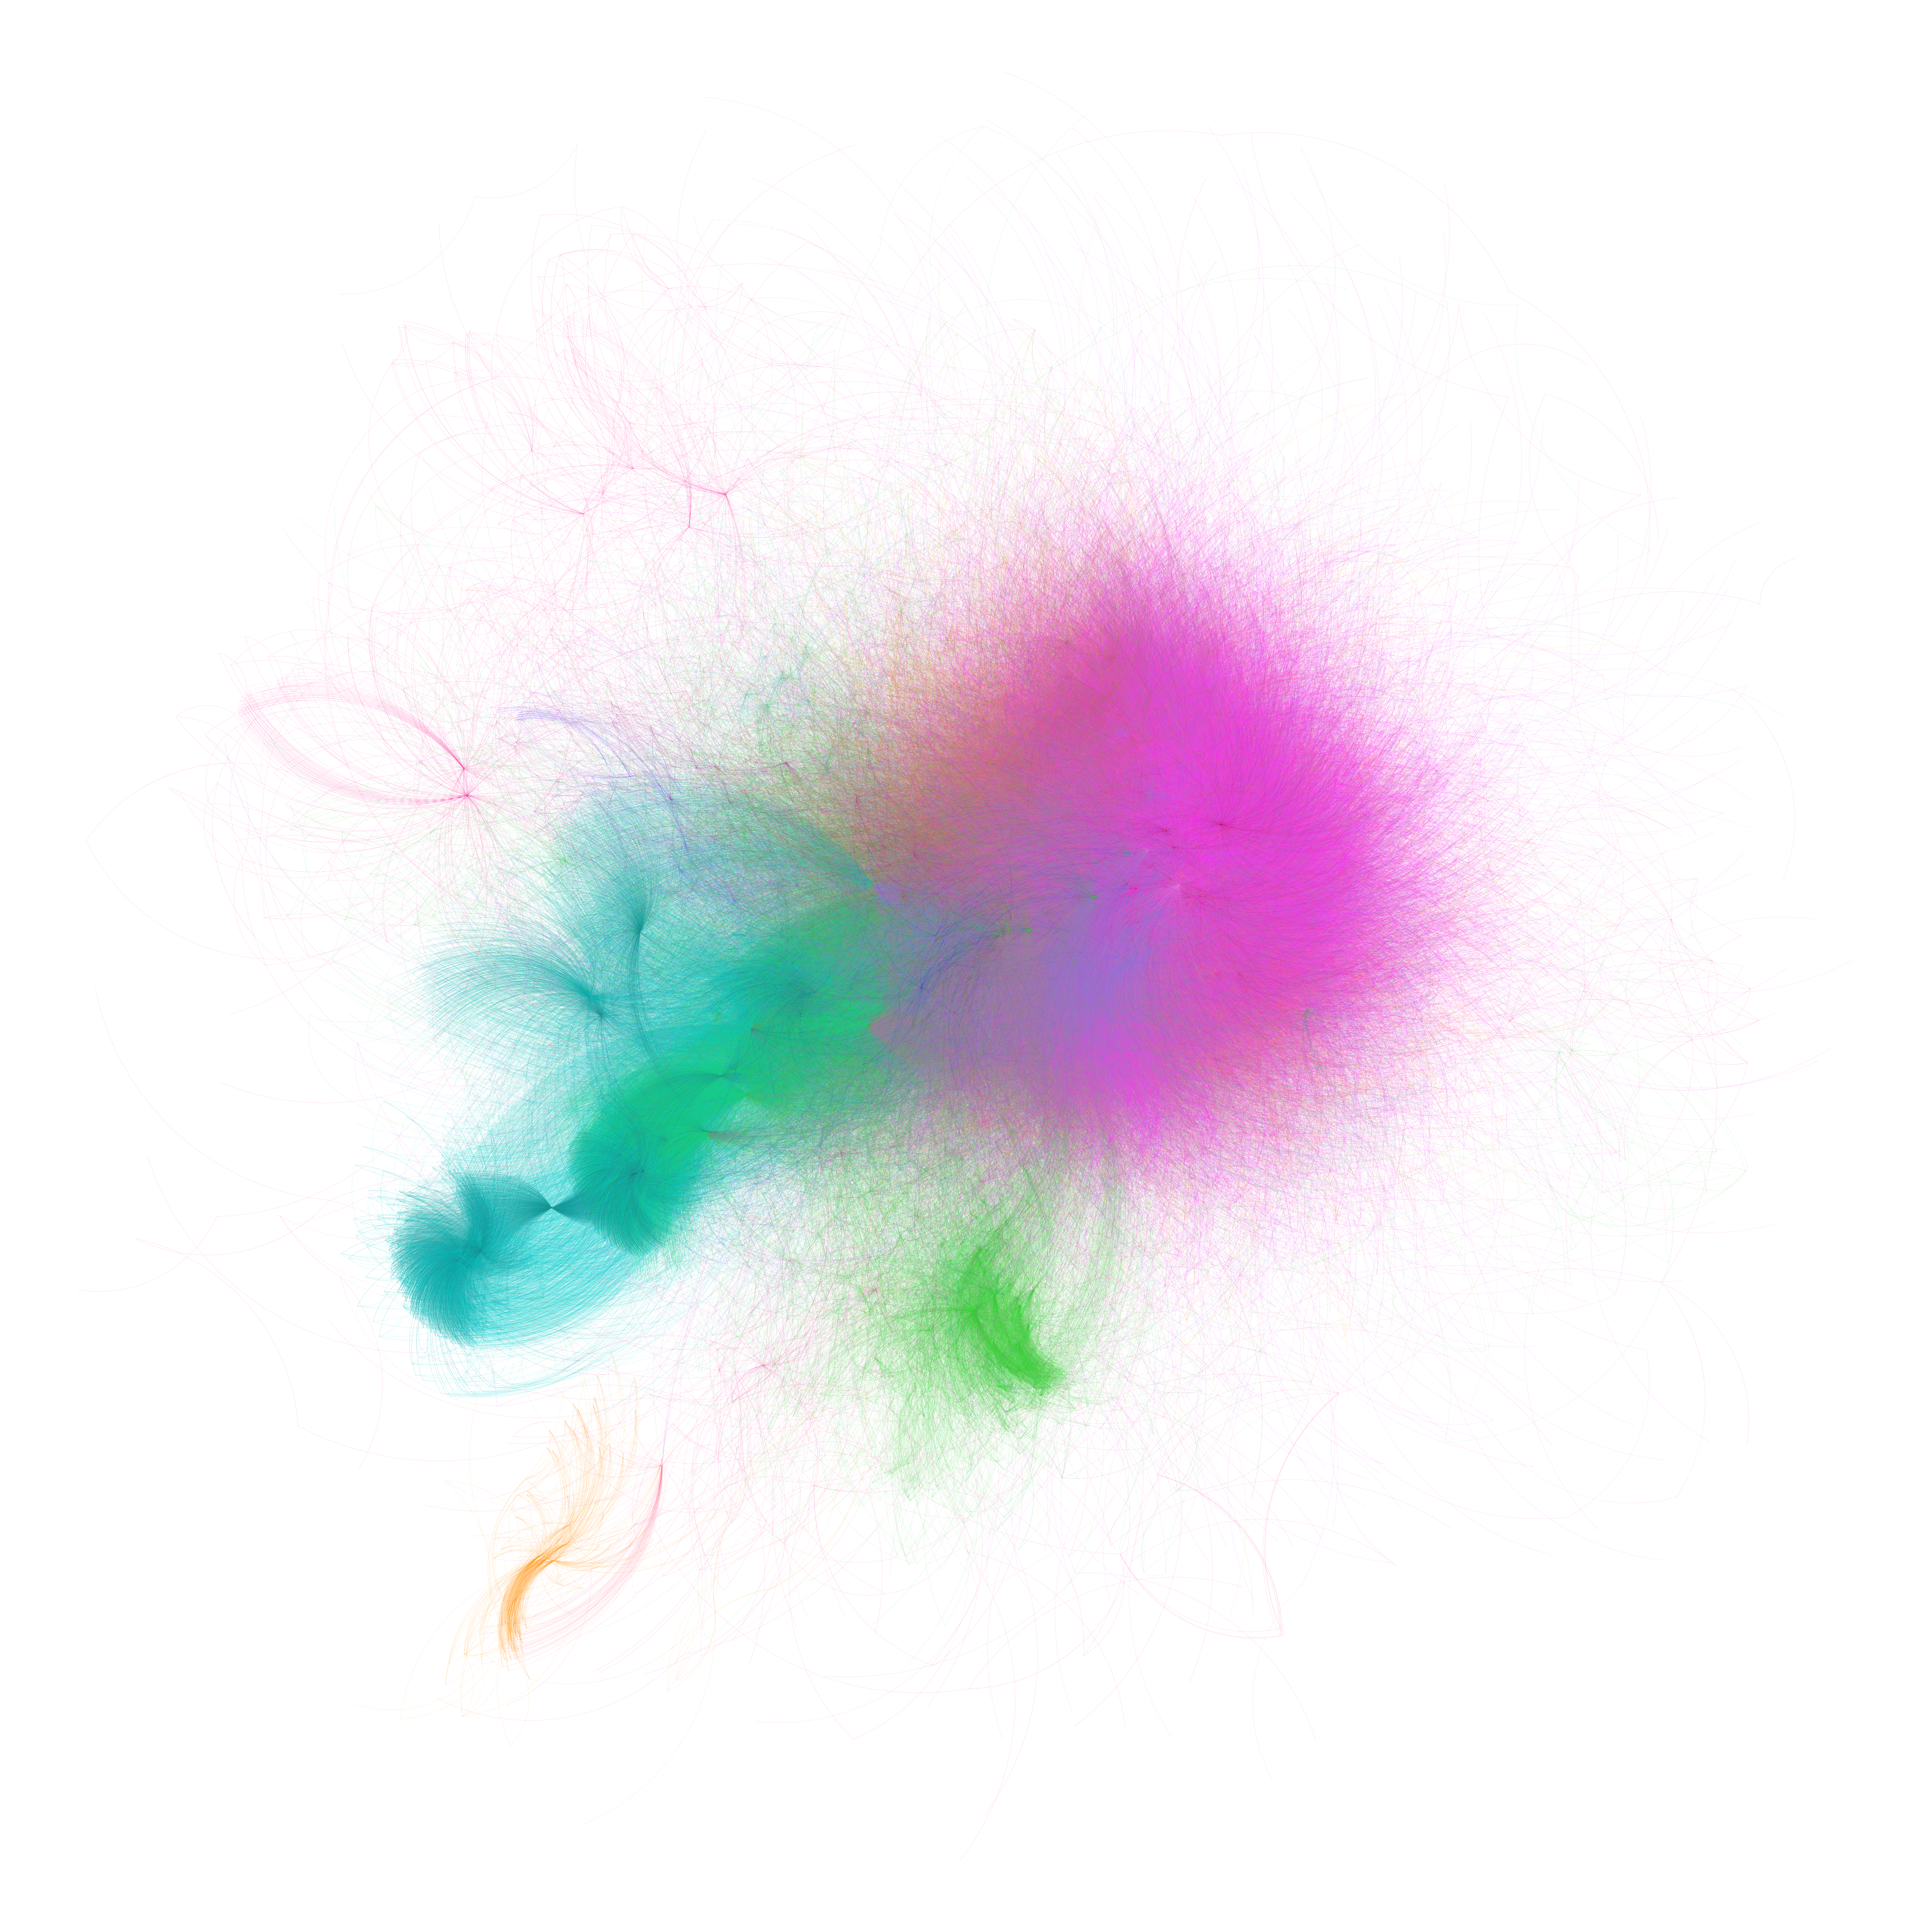
Yifan Hu layout
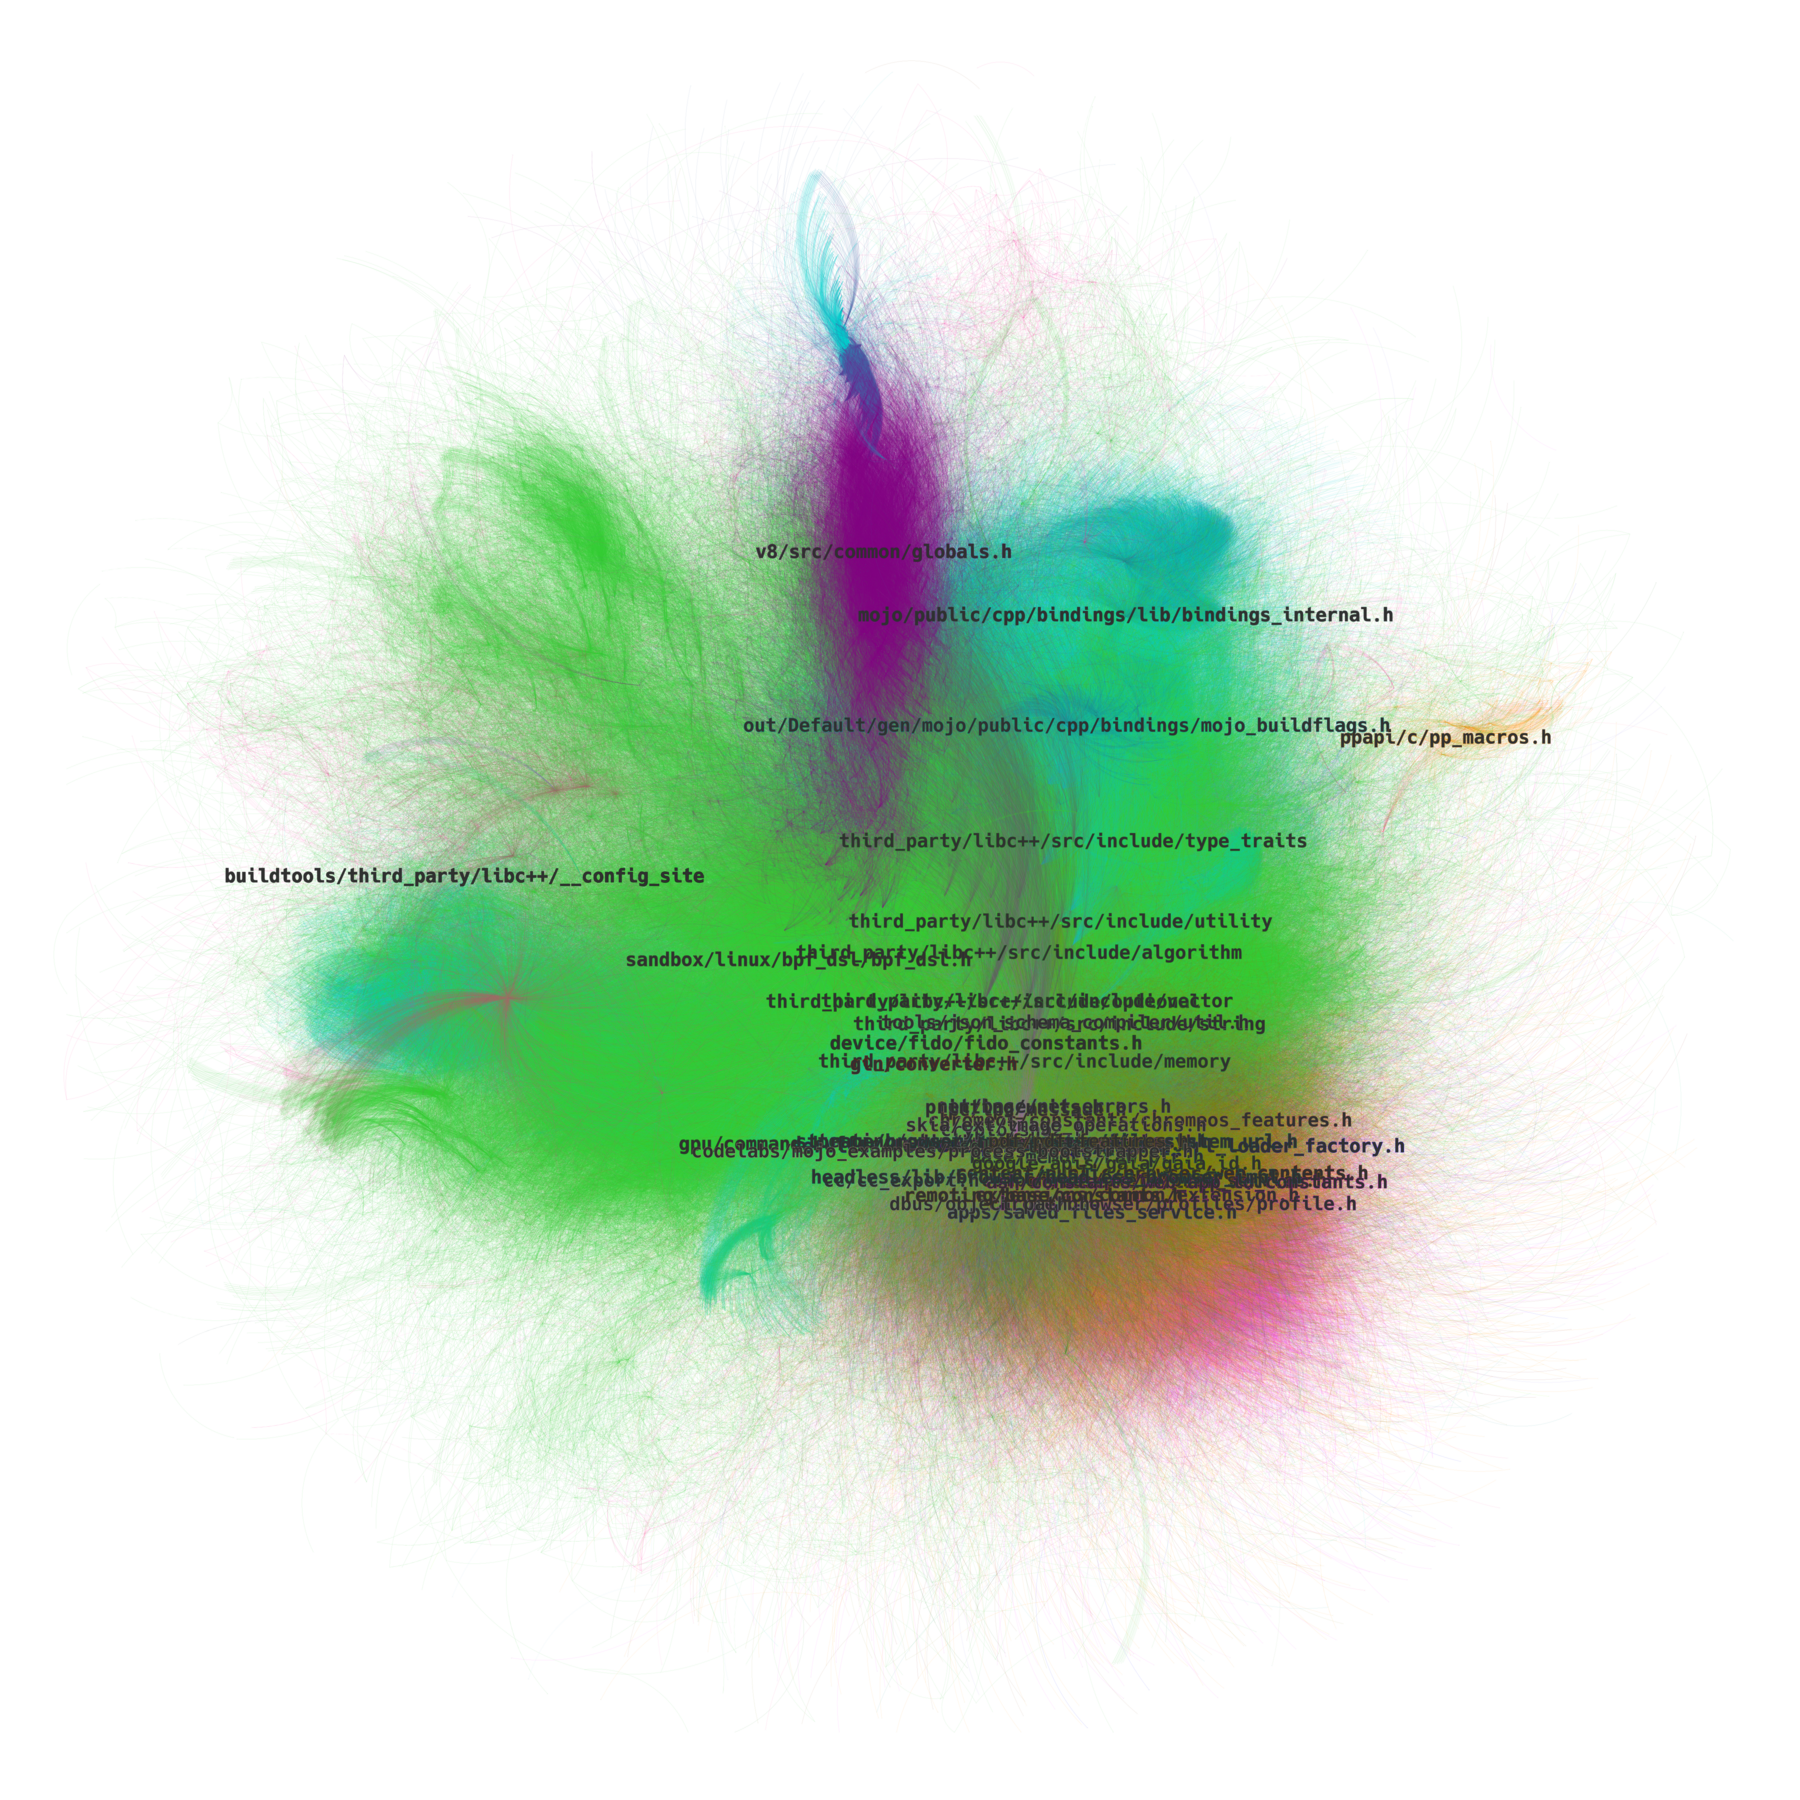
This one took about 20 minutes to settle and didn’t really expand too much. Unfortunately it is very strongly dominated by internal third_party includes. YifanHu layout has 2 parameters that could help spread the diagram further, namely Optimal Distance and Relative Strength, however increasing them too much very quickly leads to the same issue as with the circular layout - canvas clipping.
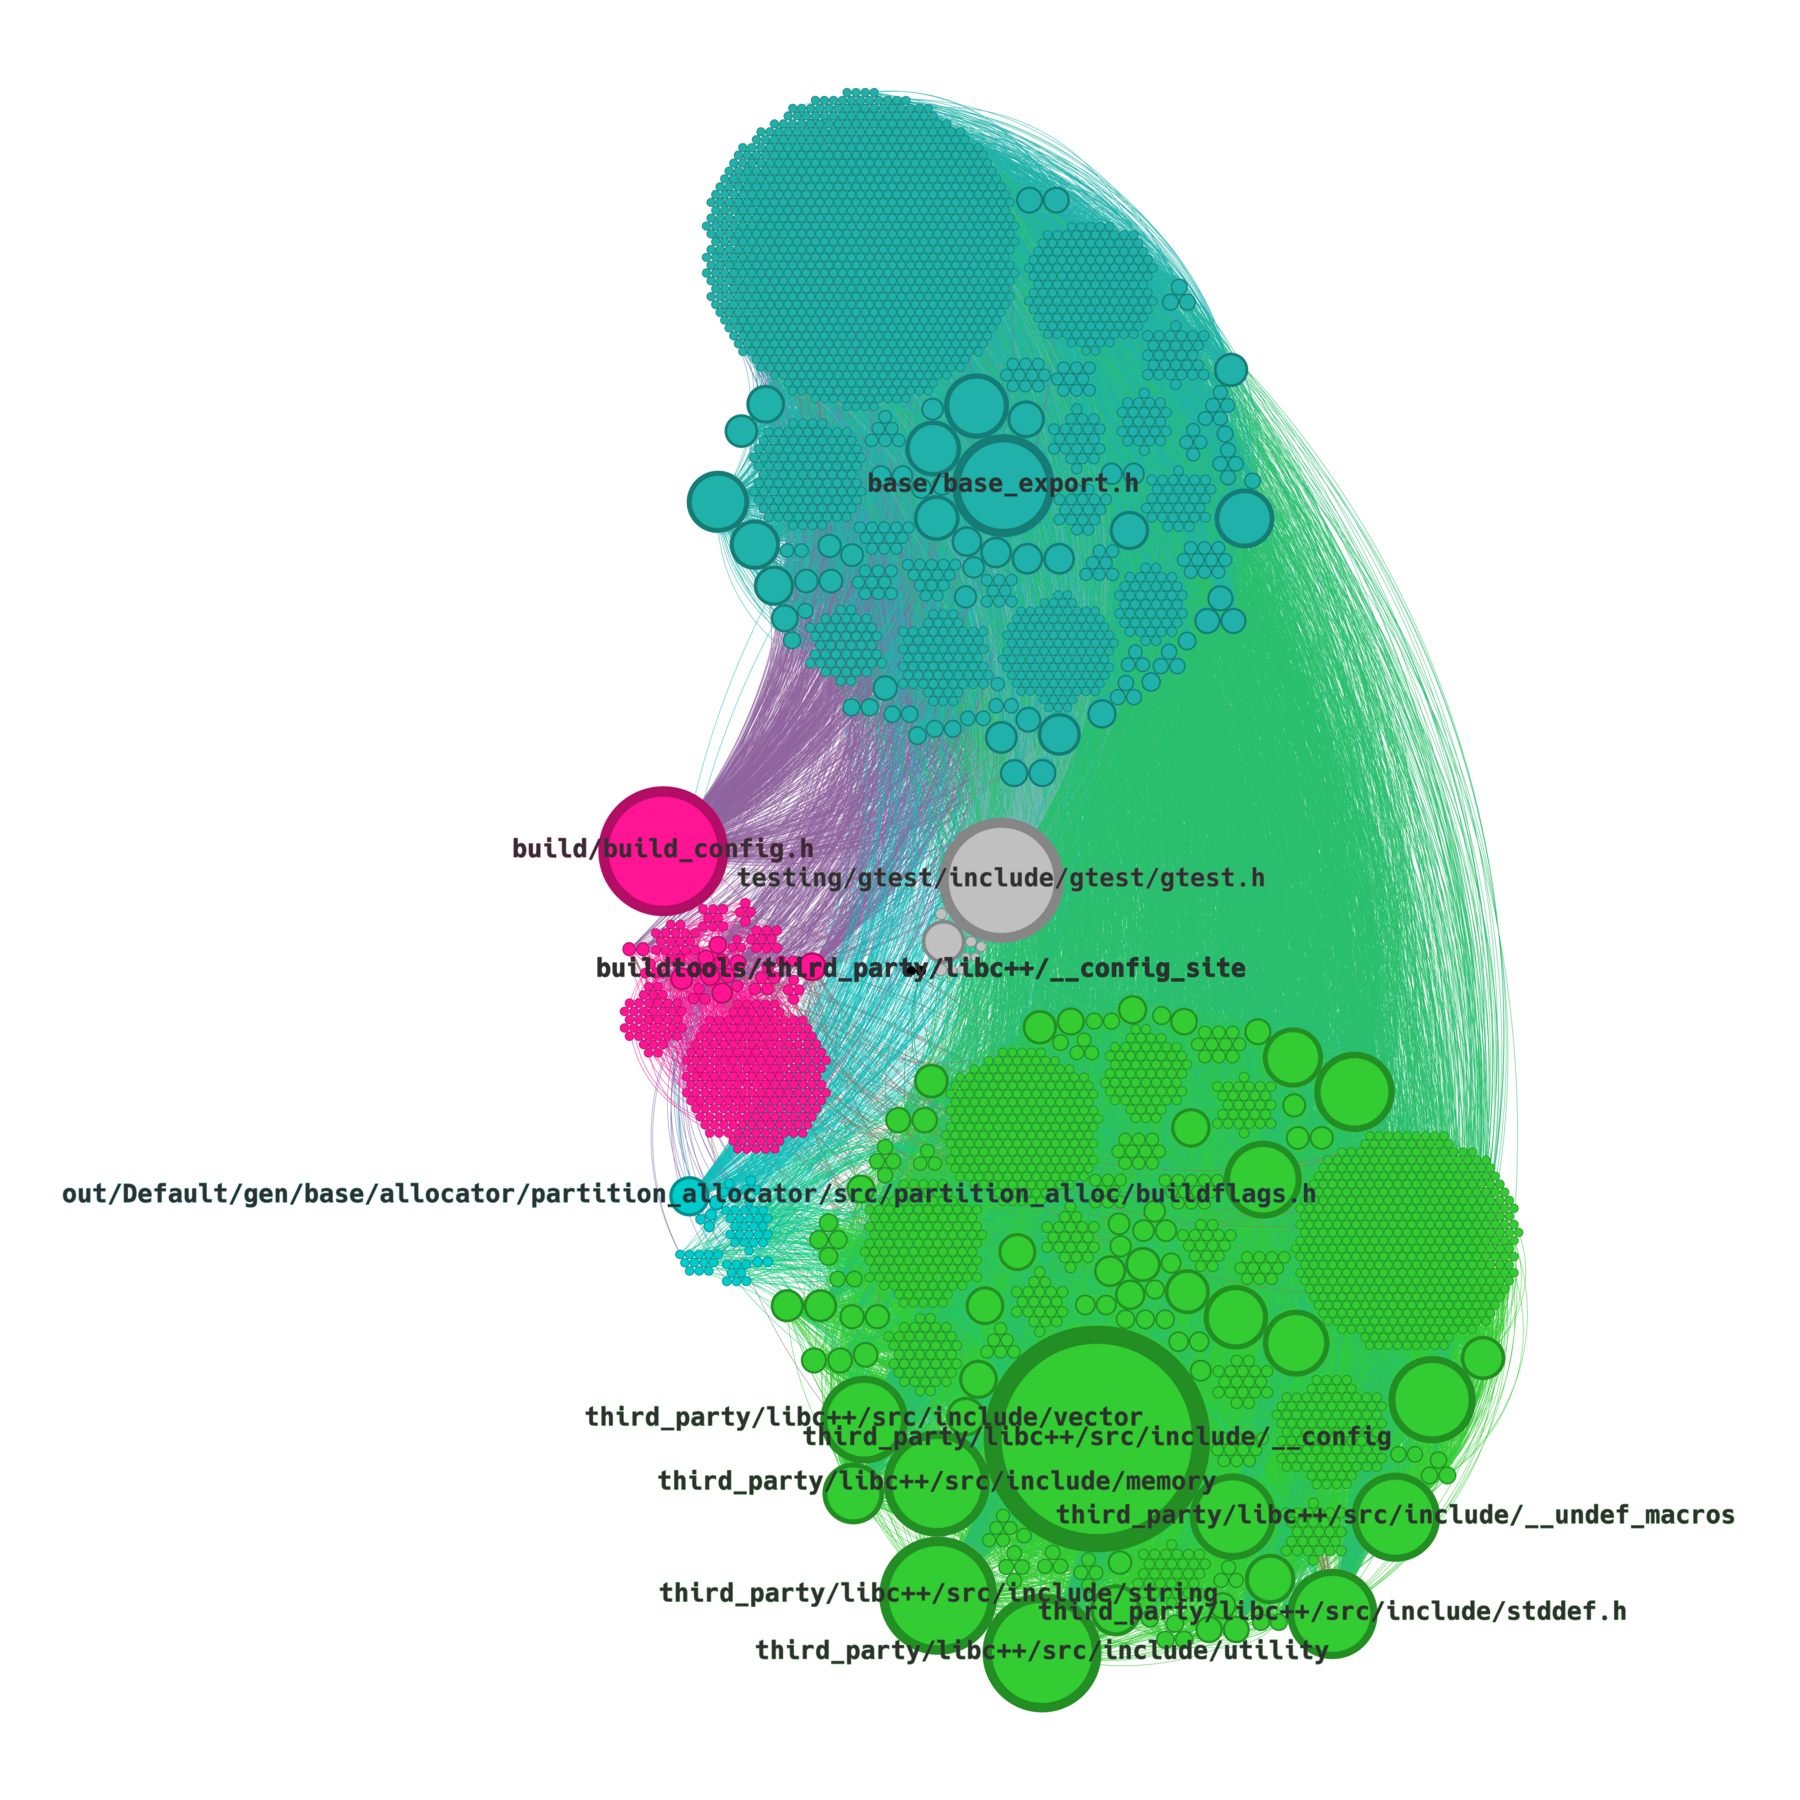
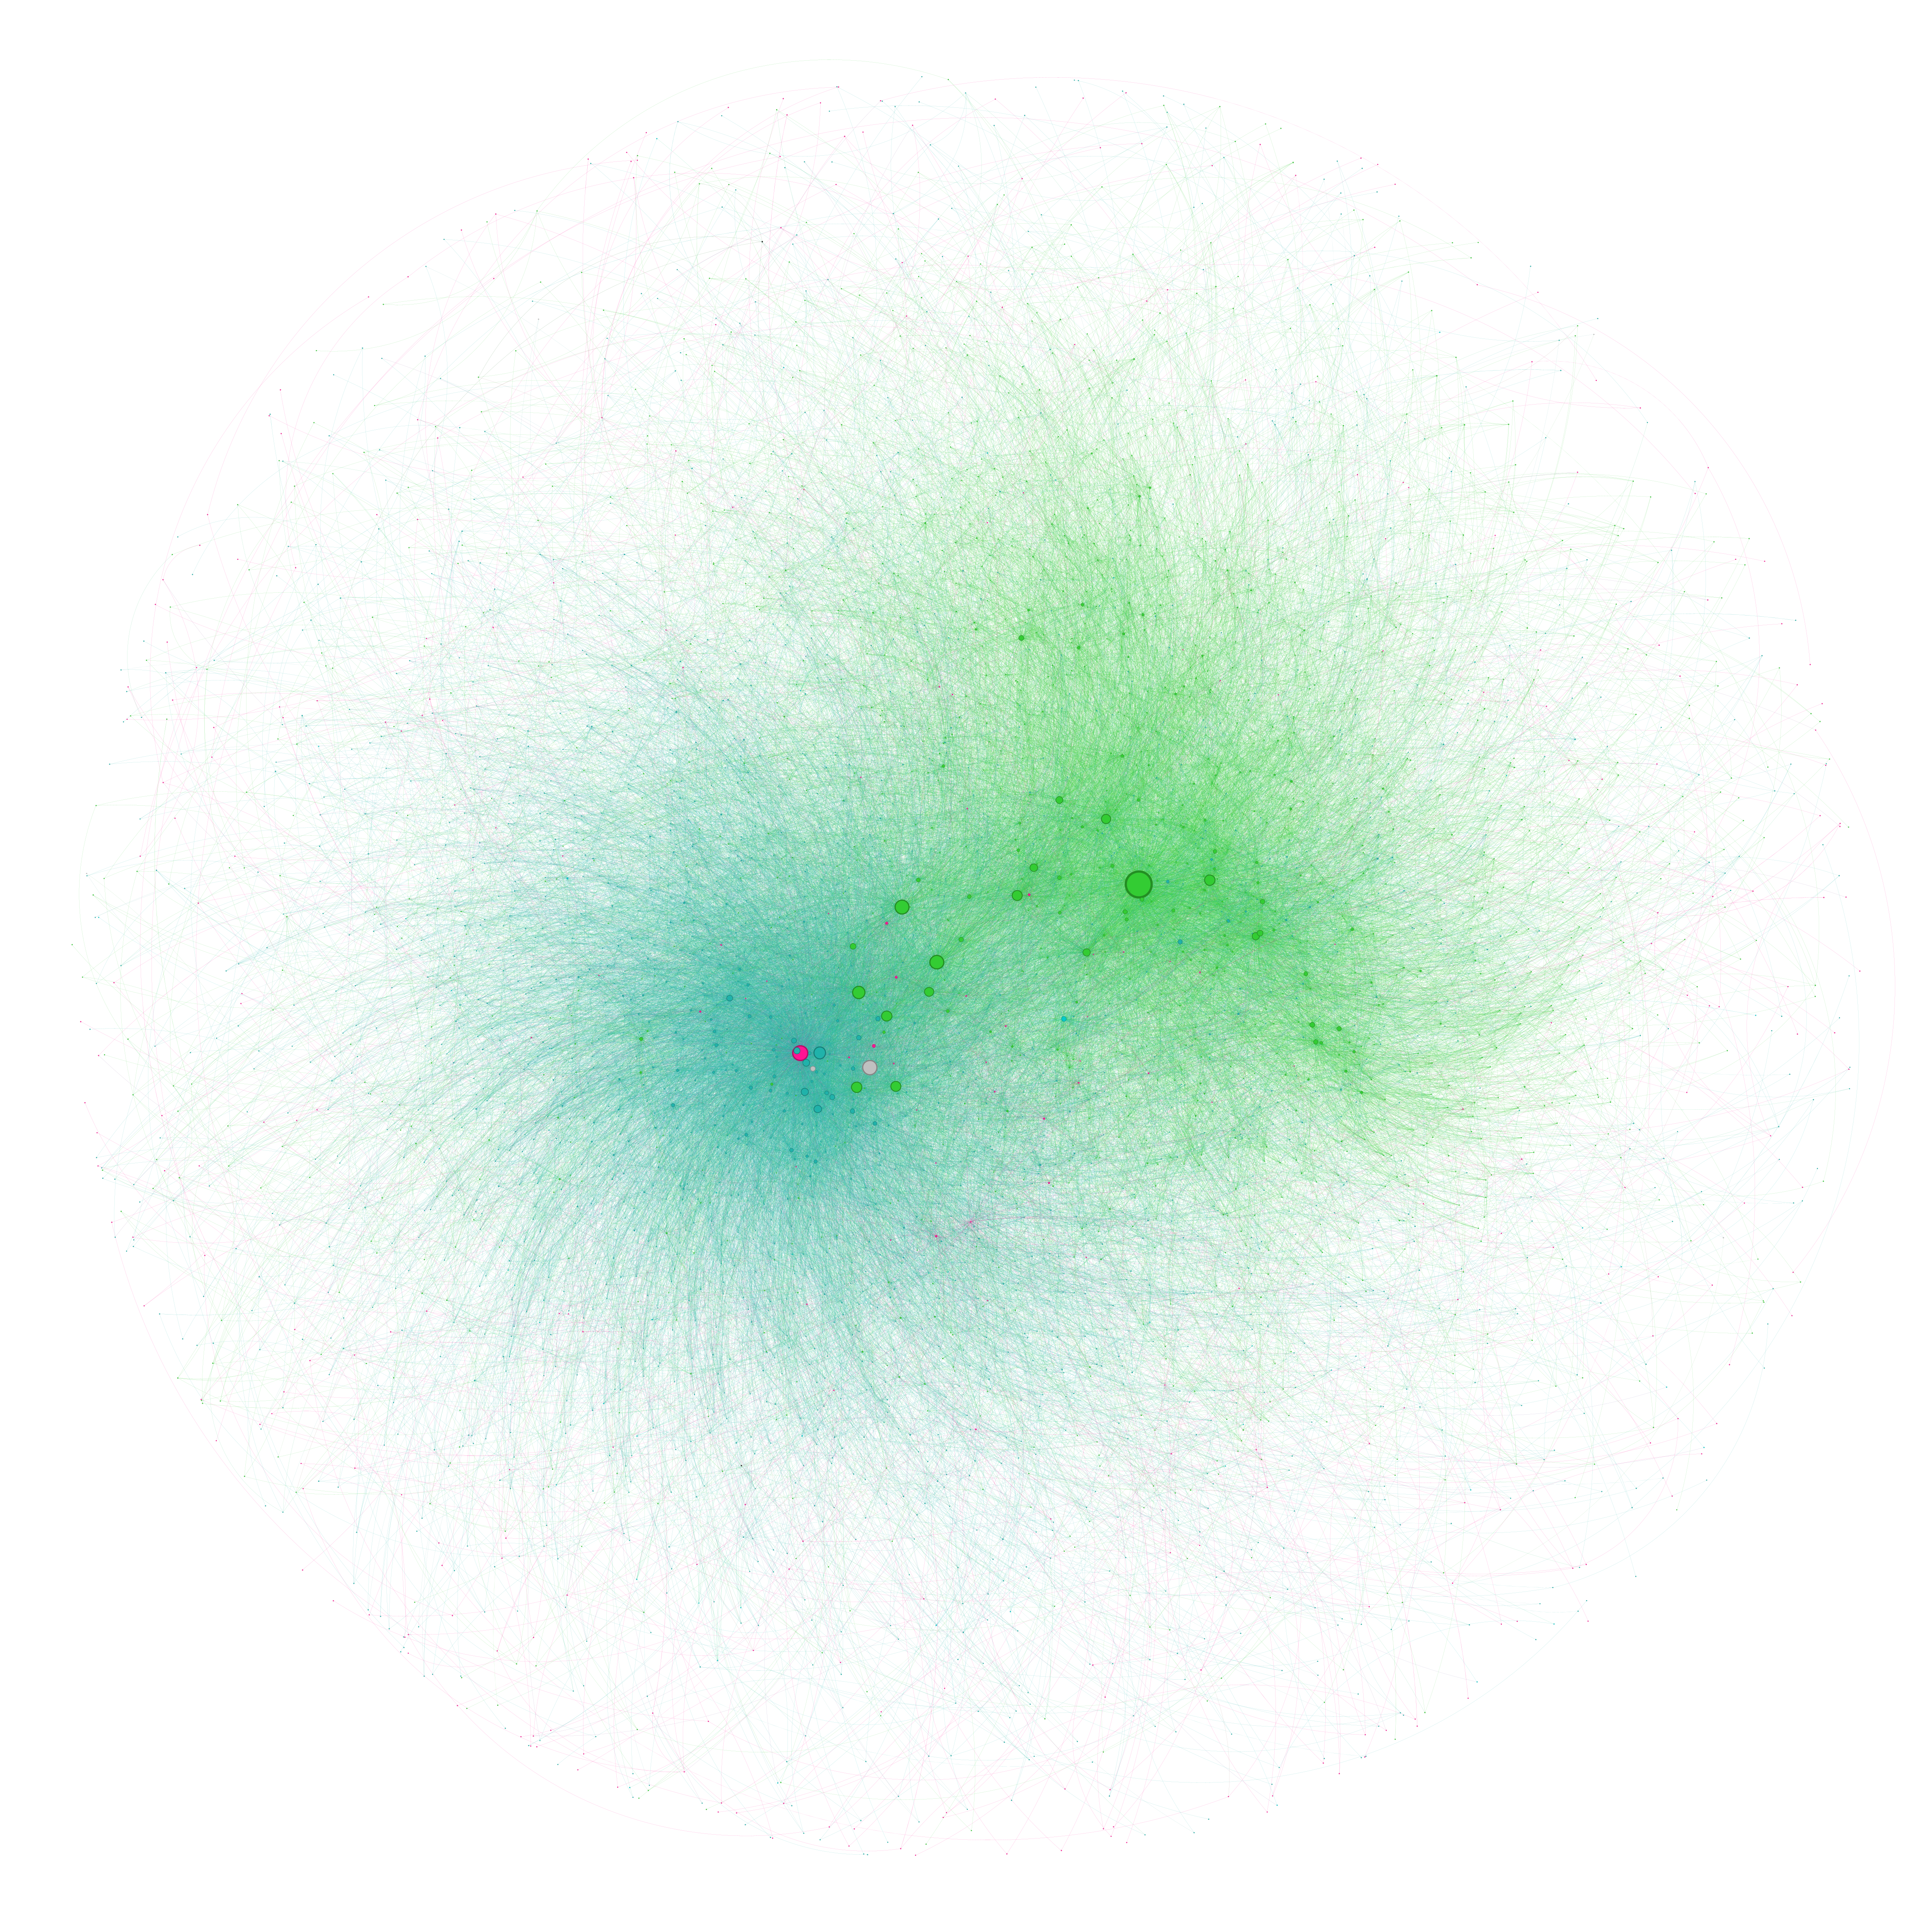
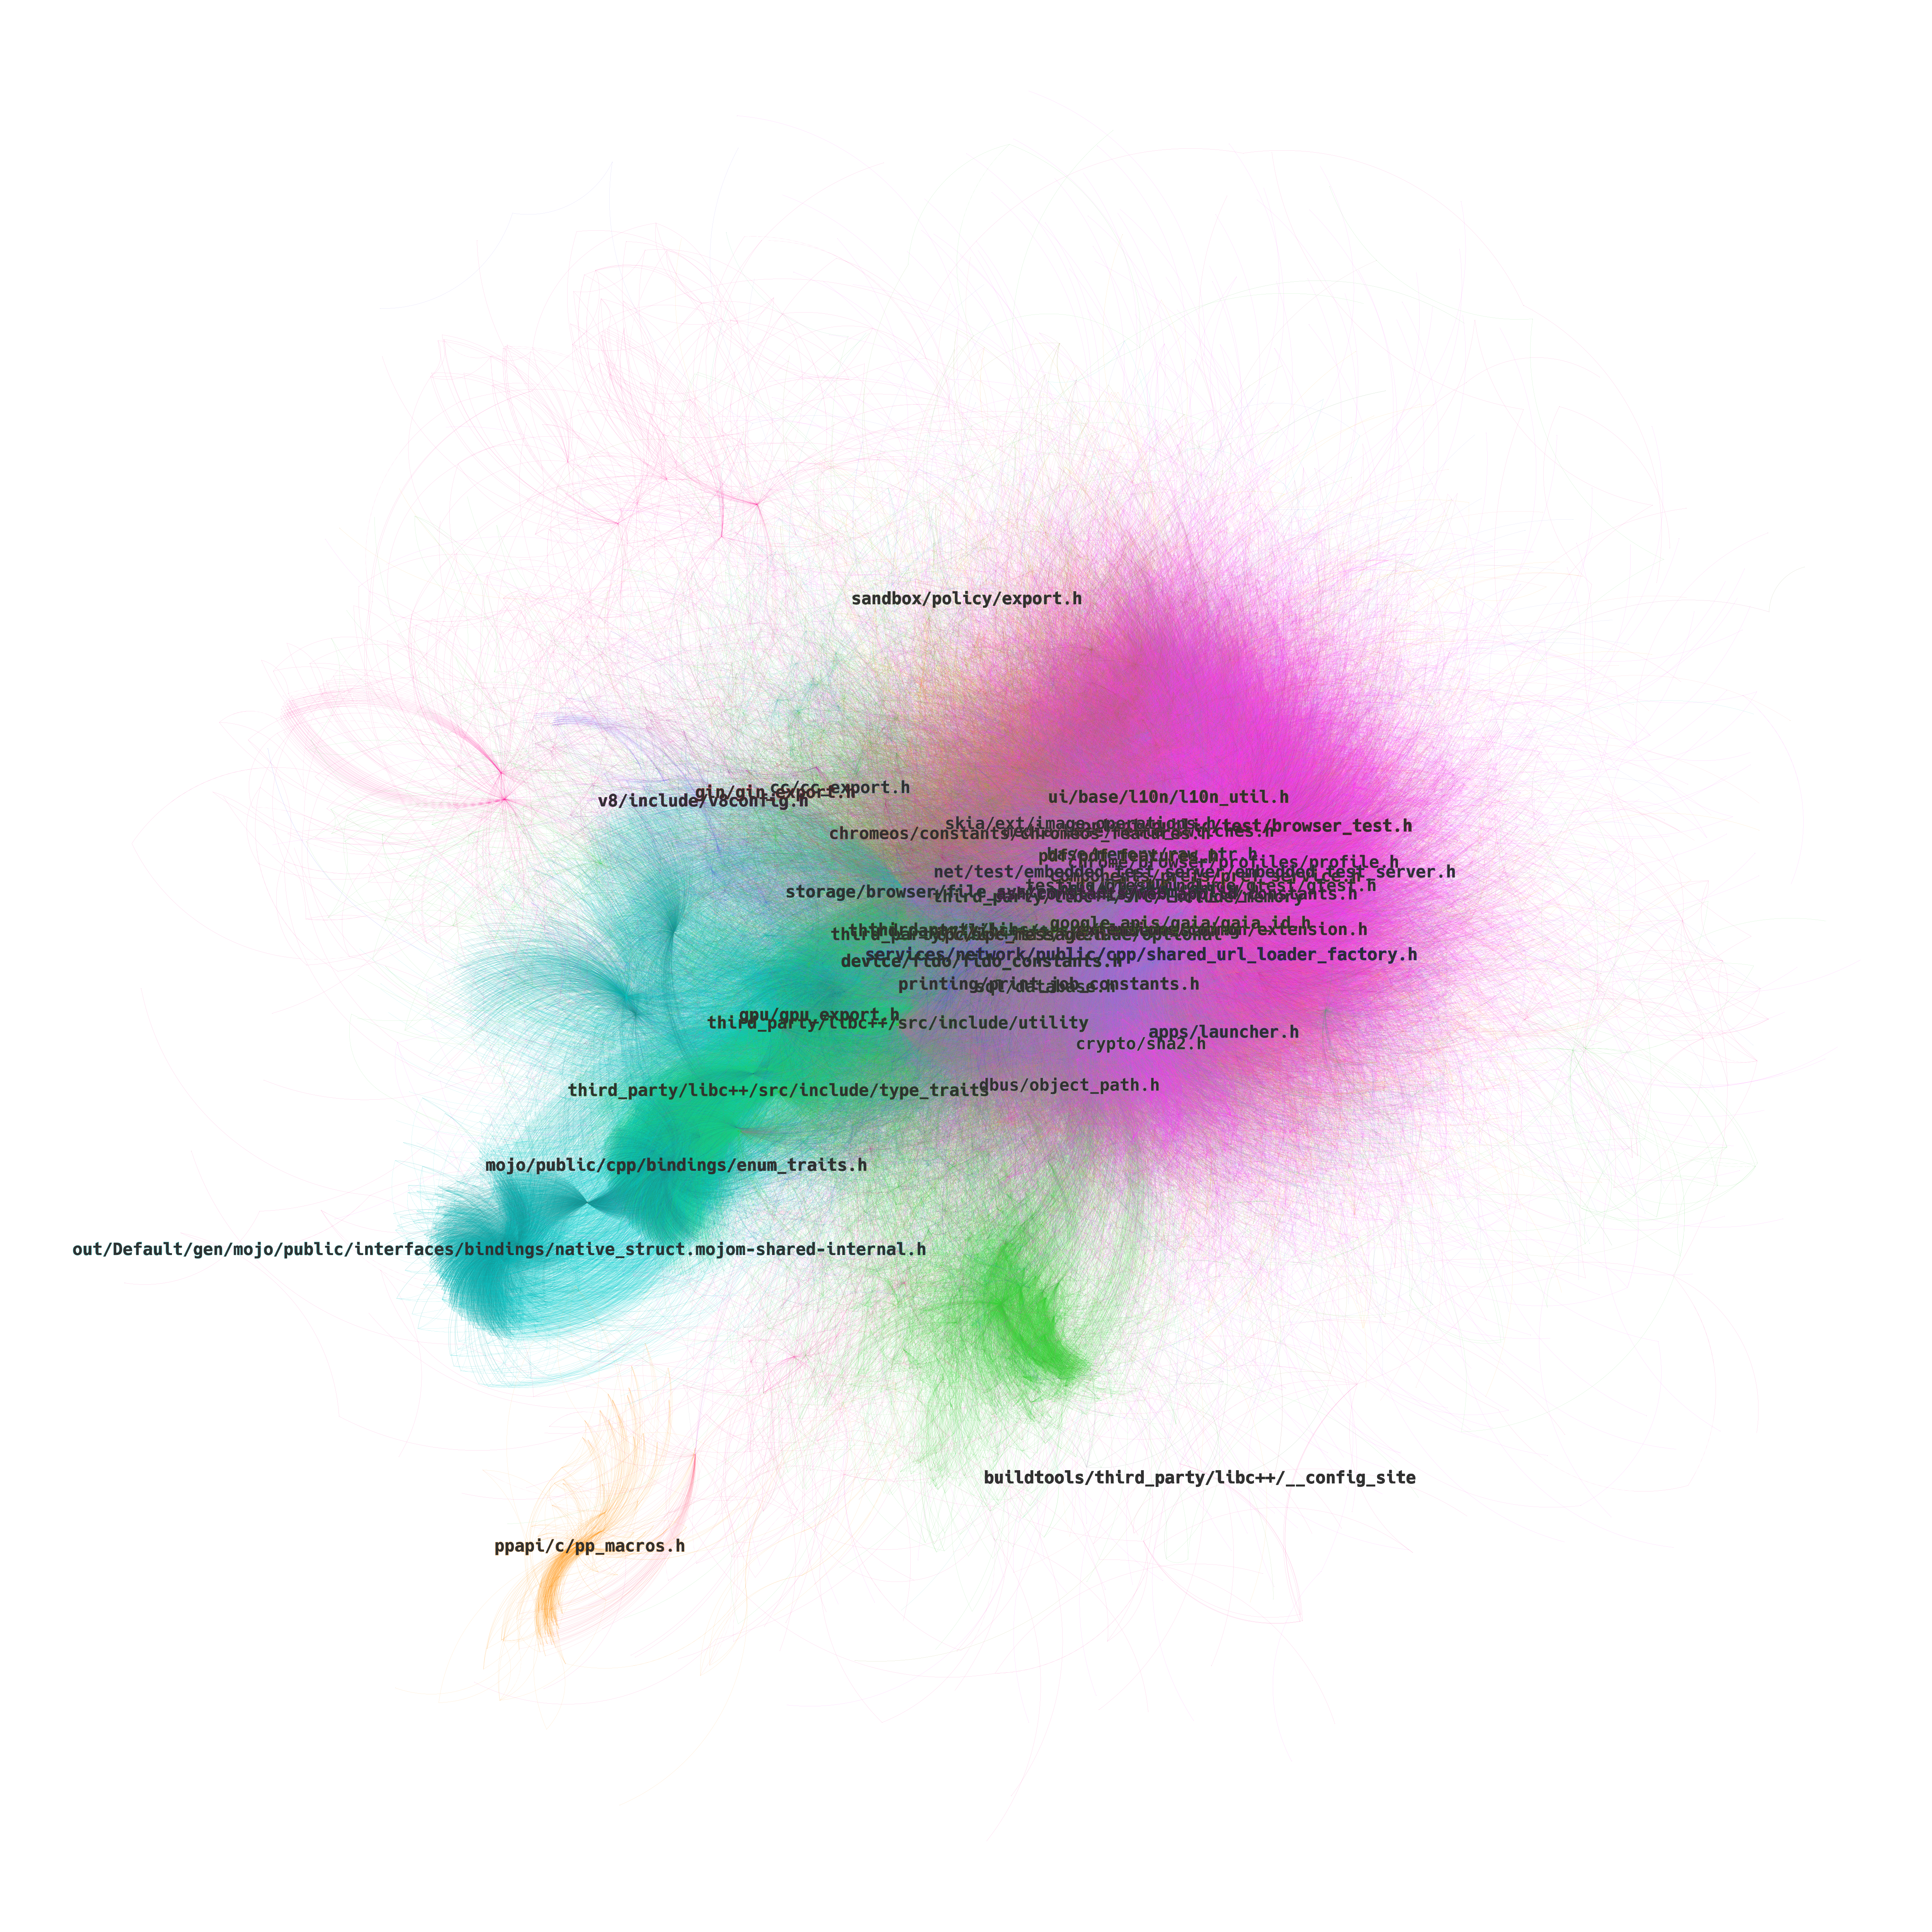
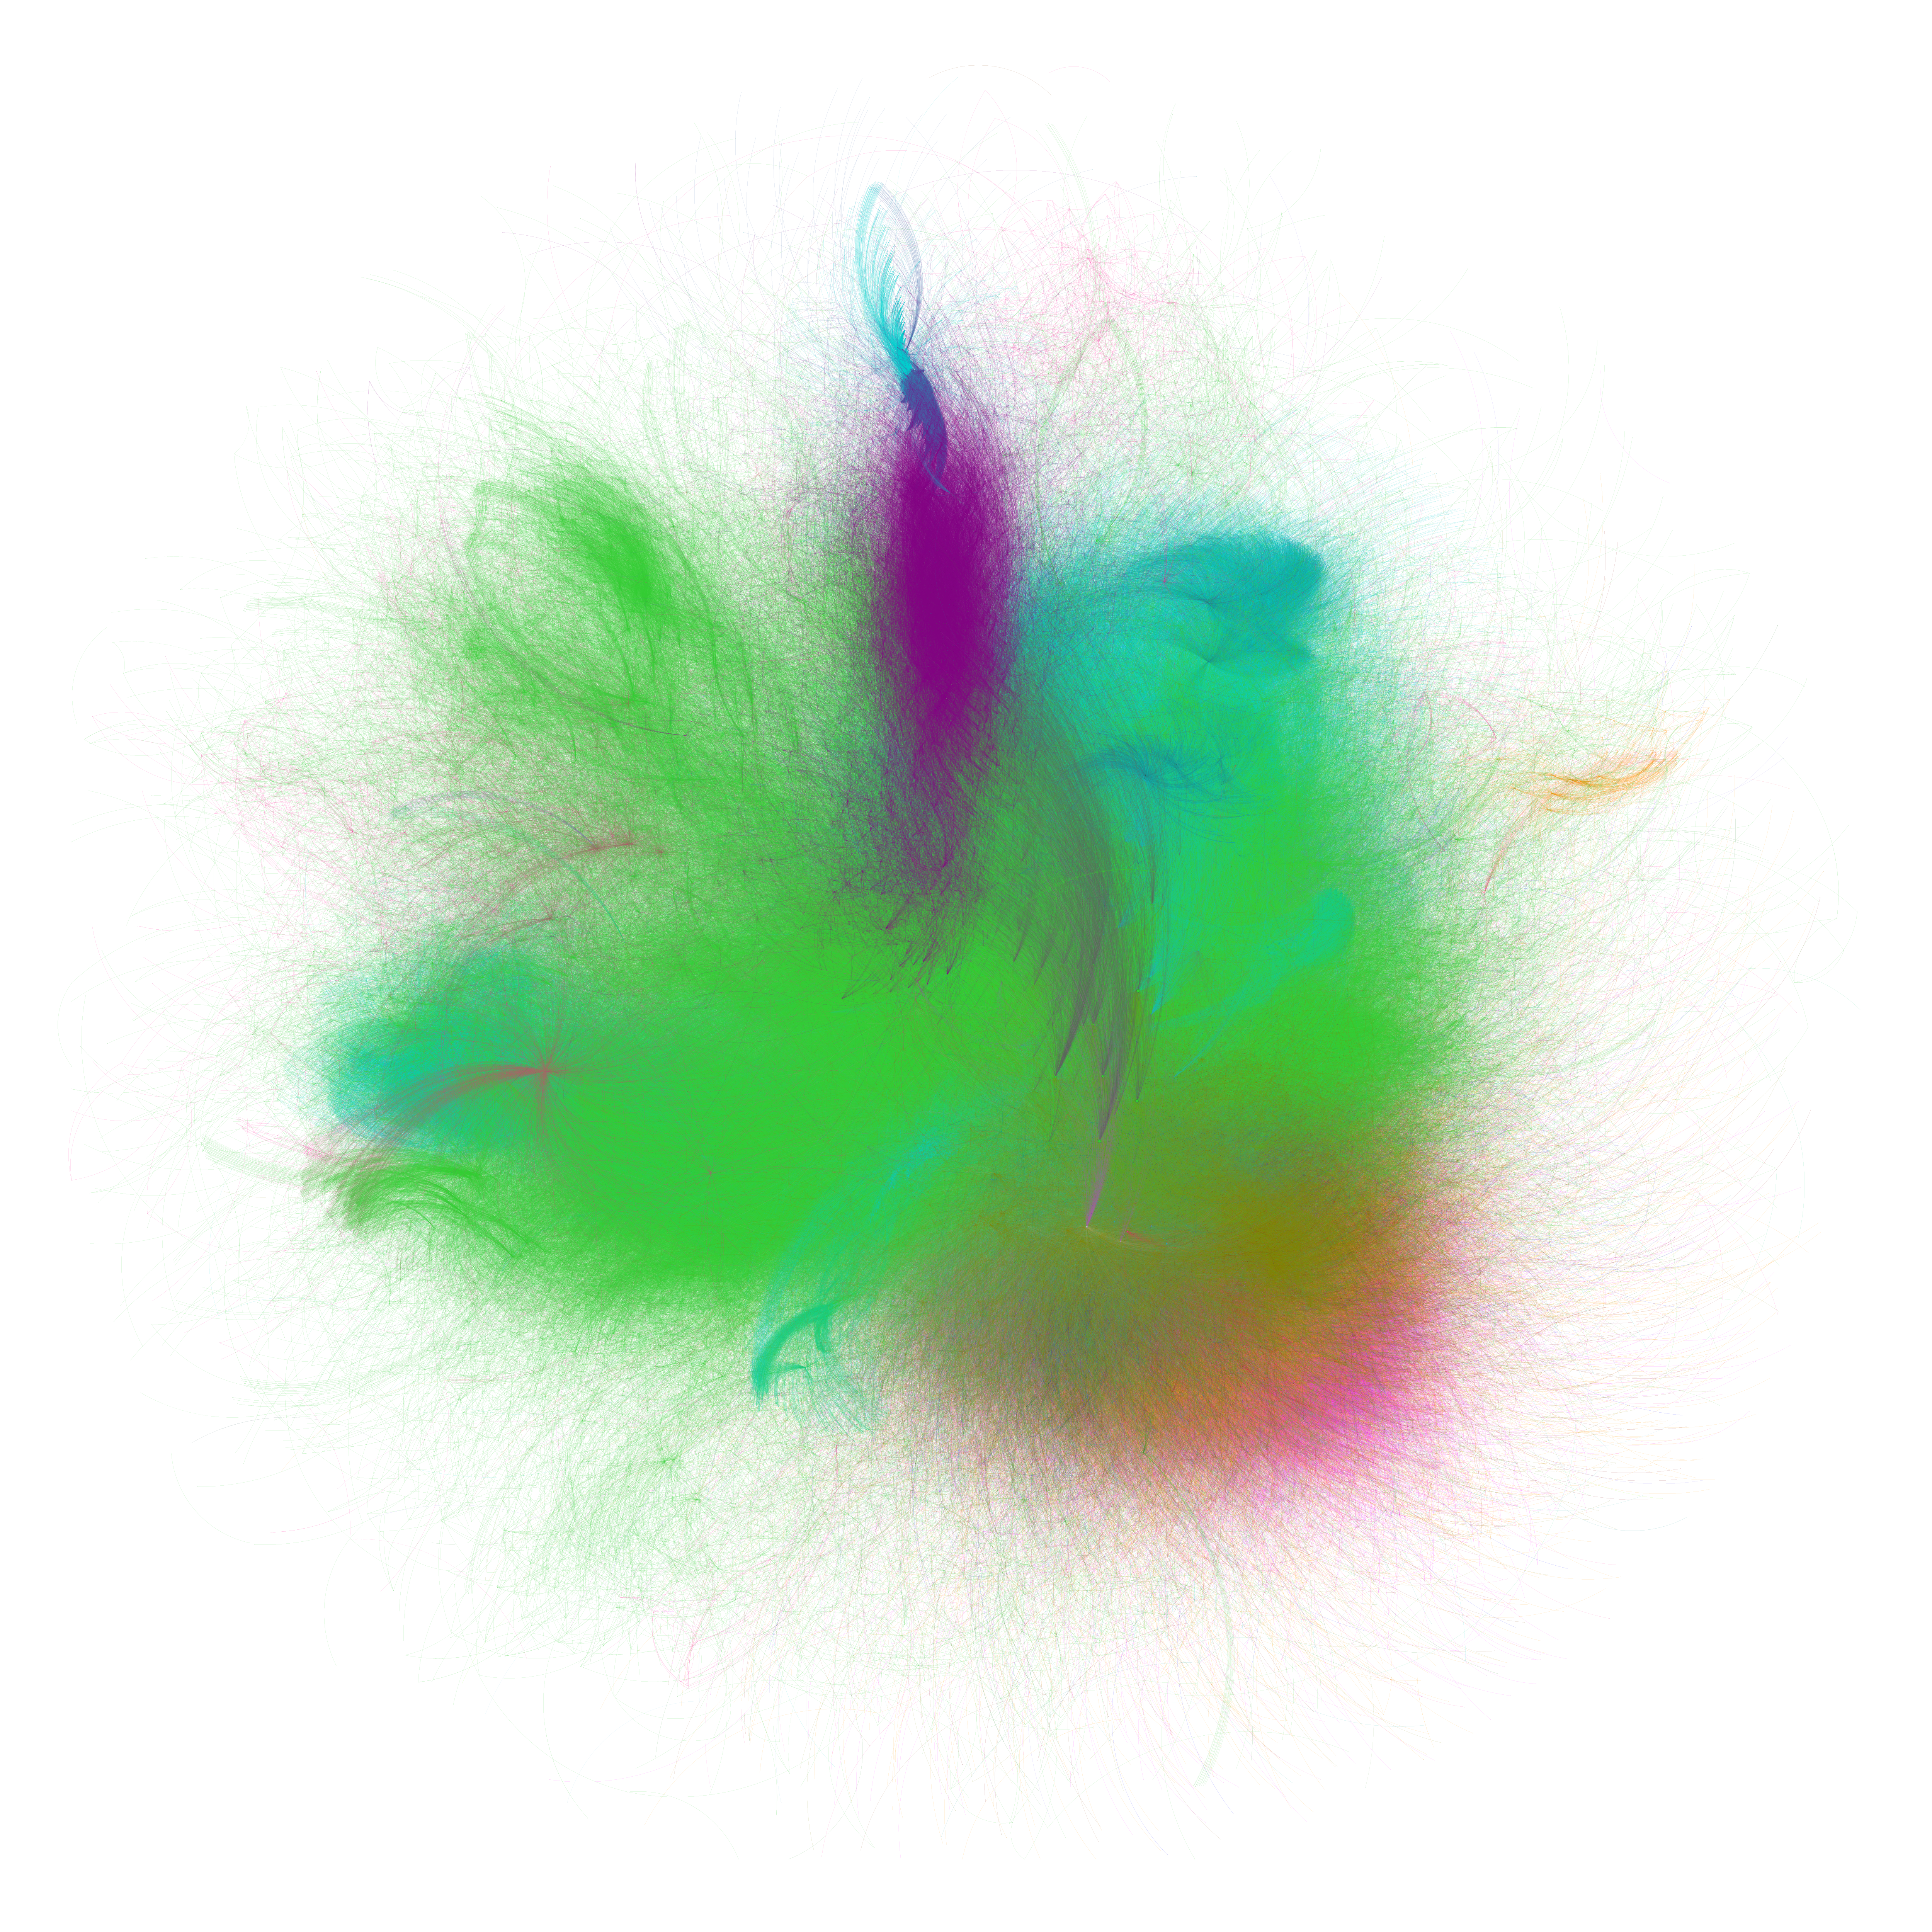
What we can do instead, is try to remove all nodes (and edges) from third_party directly in Gephi’s Data Laboratory view, and recalculate the layout:
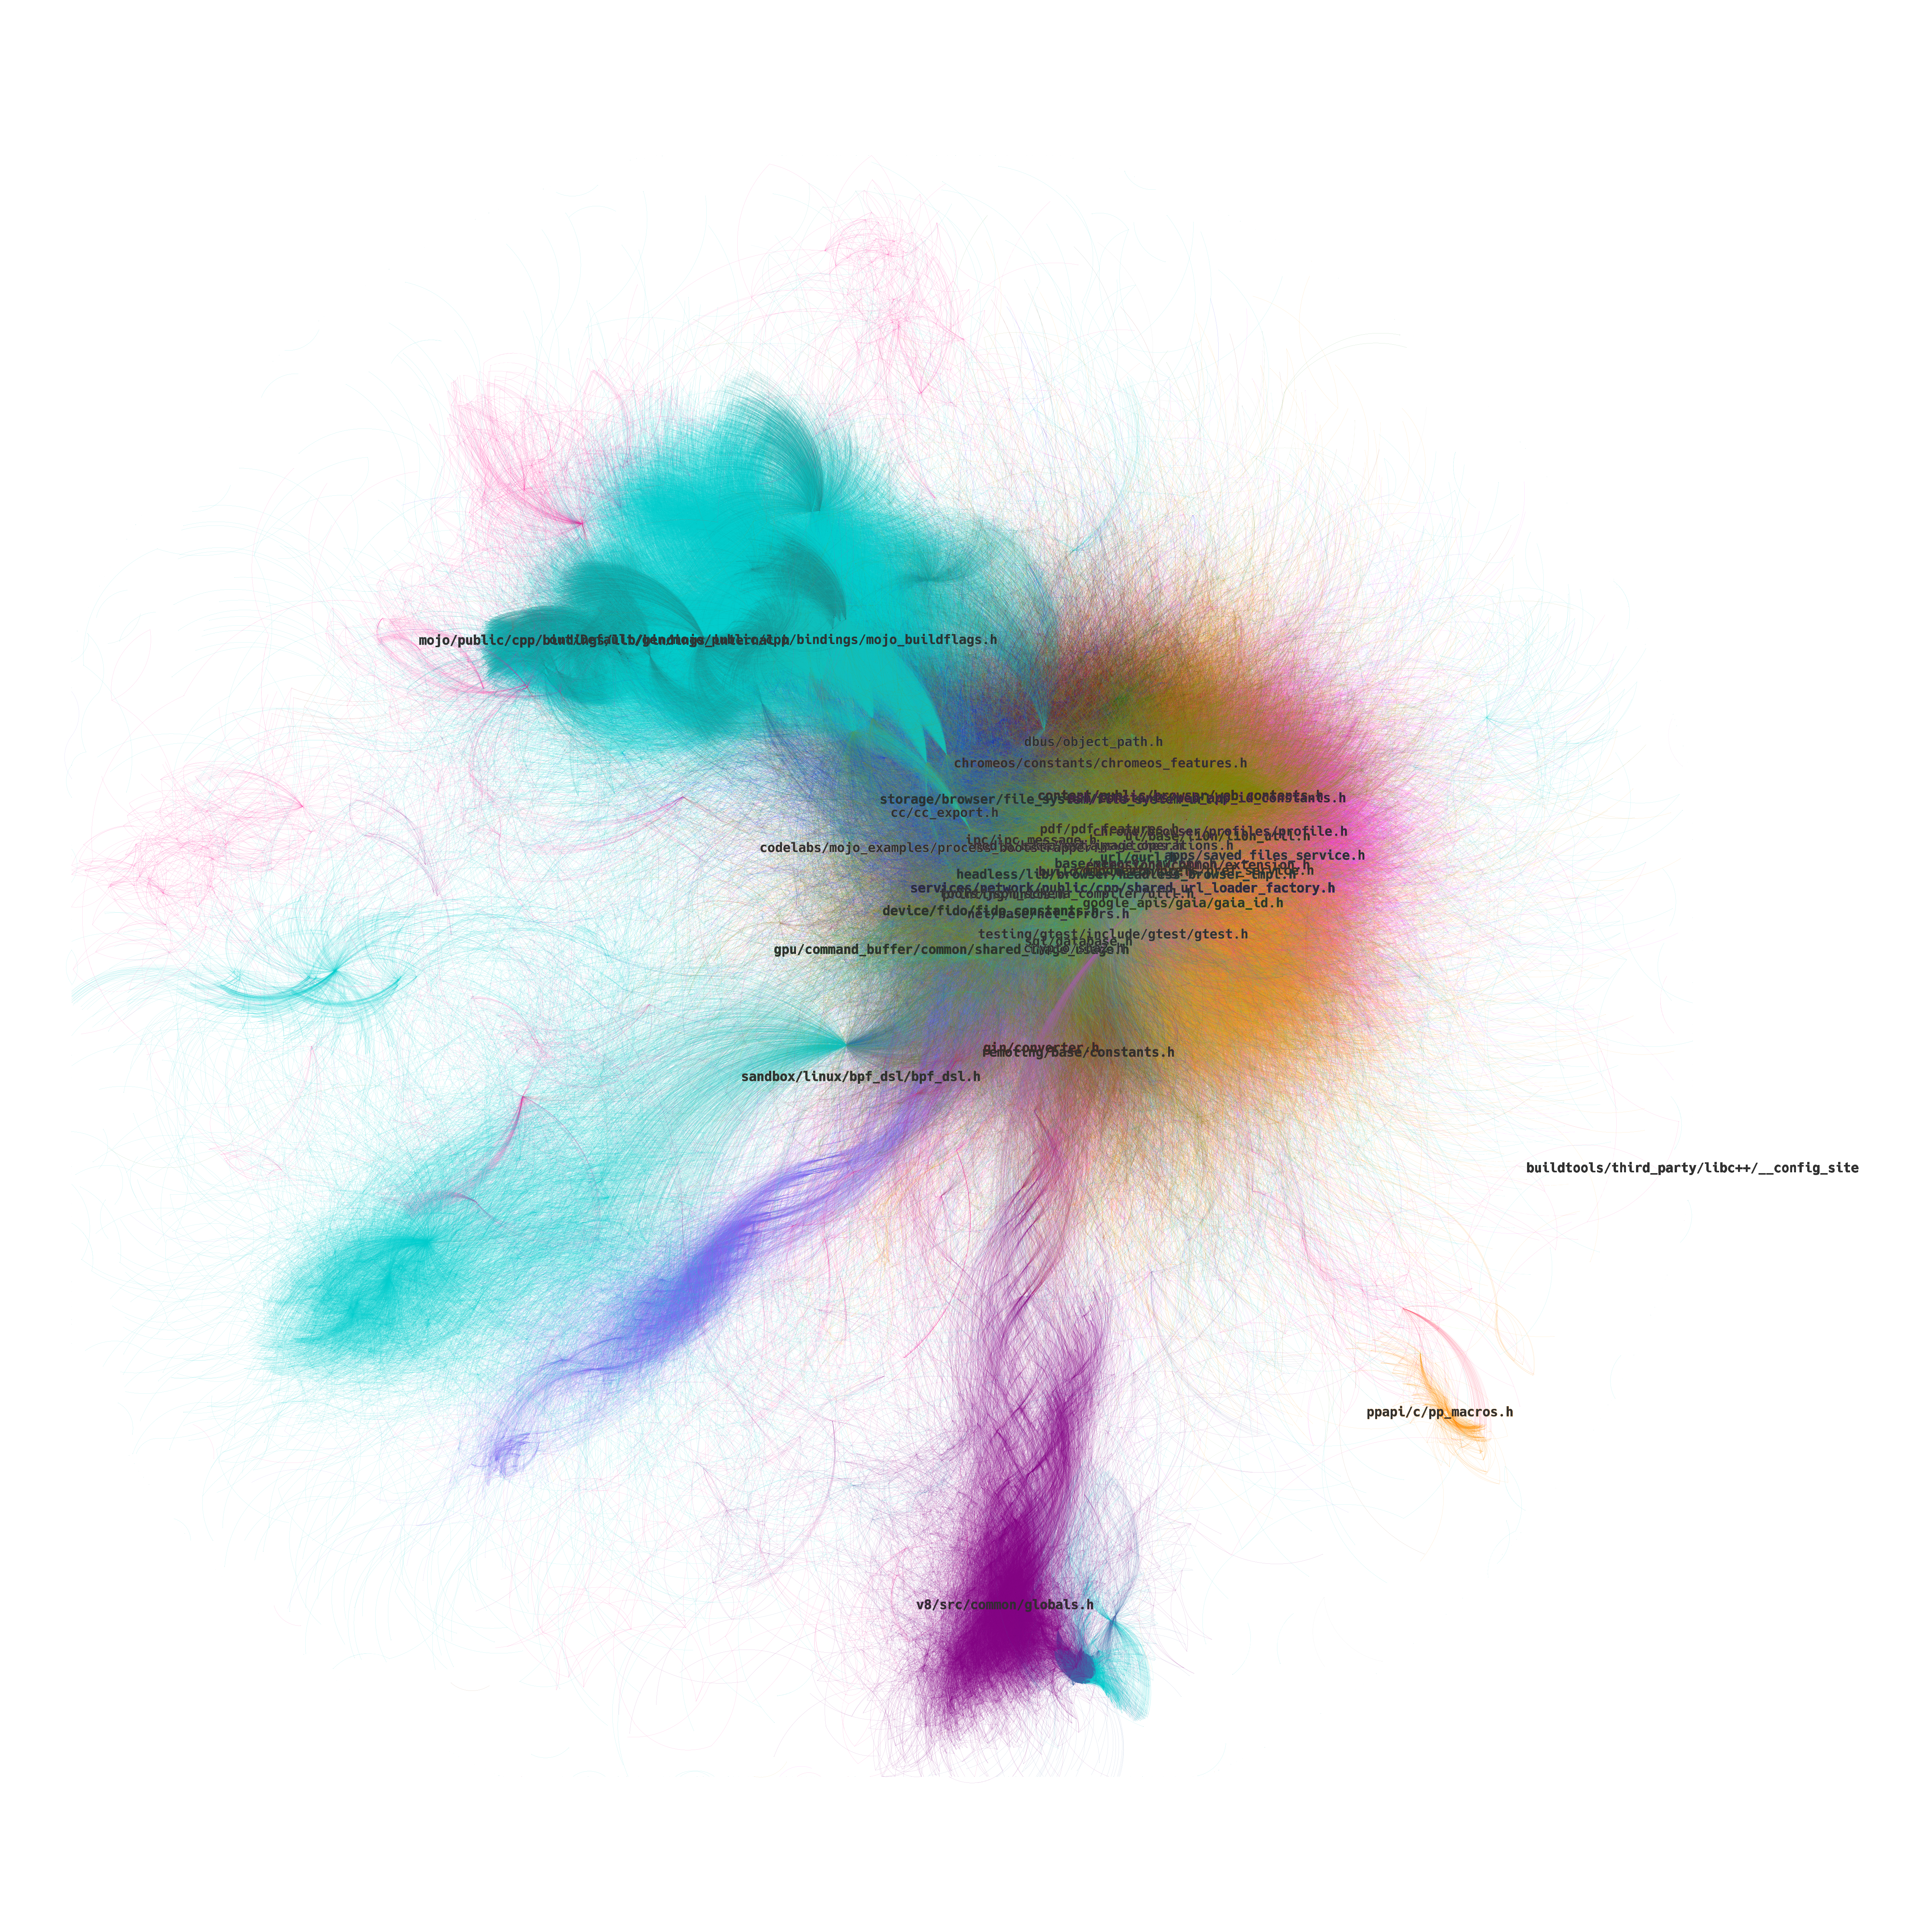
Much better. We can see how some of the components (e.g. v8, out) managed to escape the central cluster, while all other components remained more less in the center.
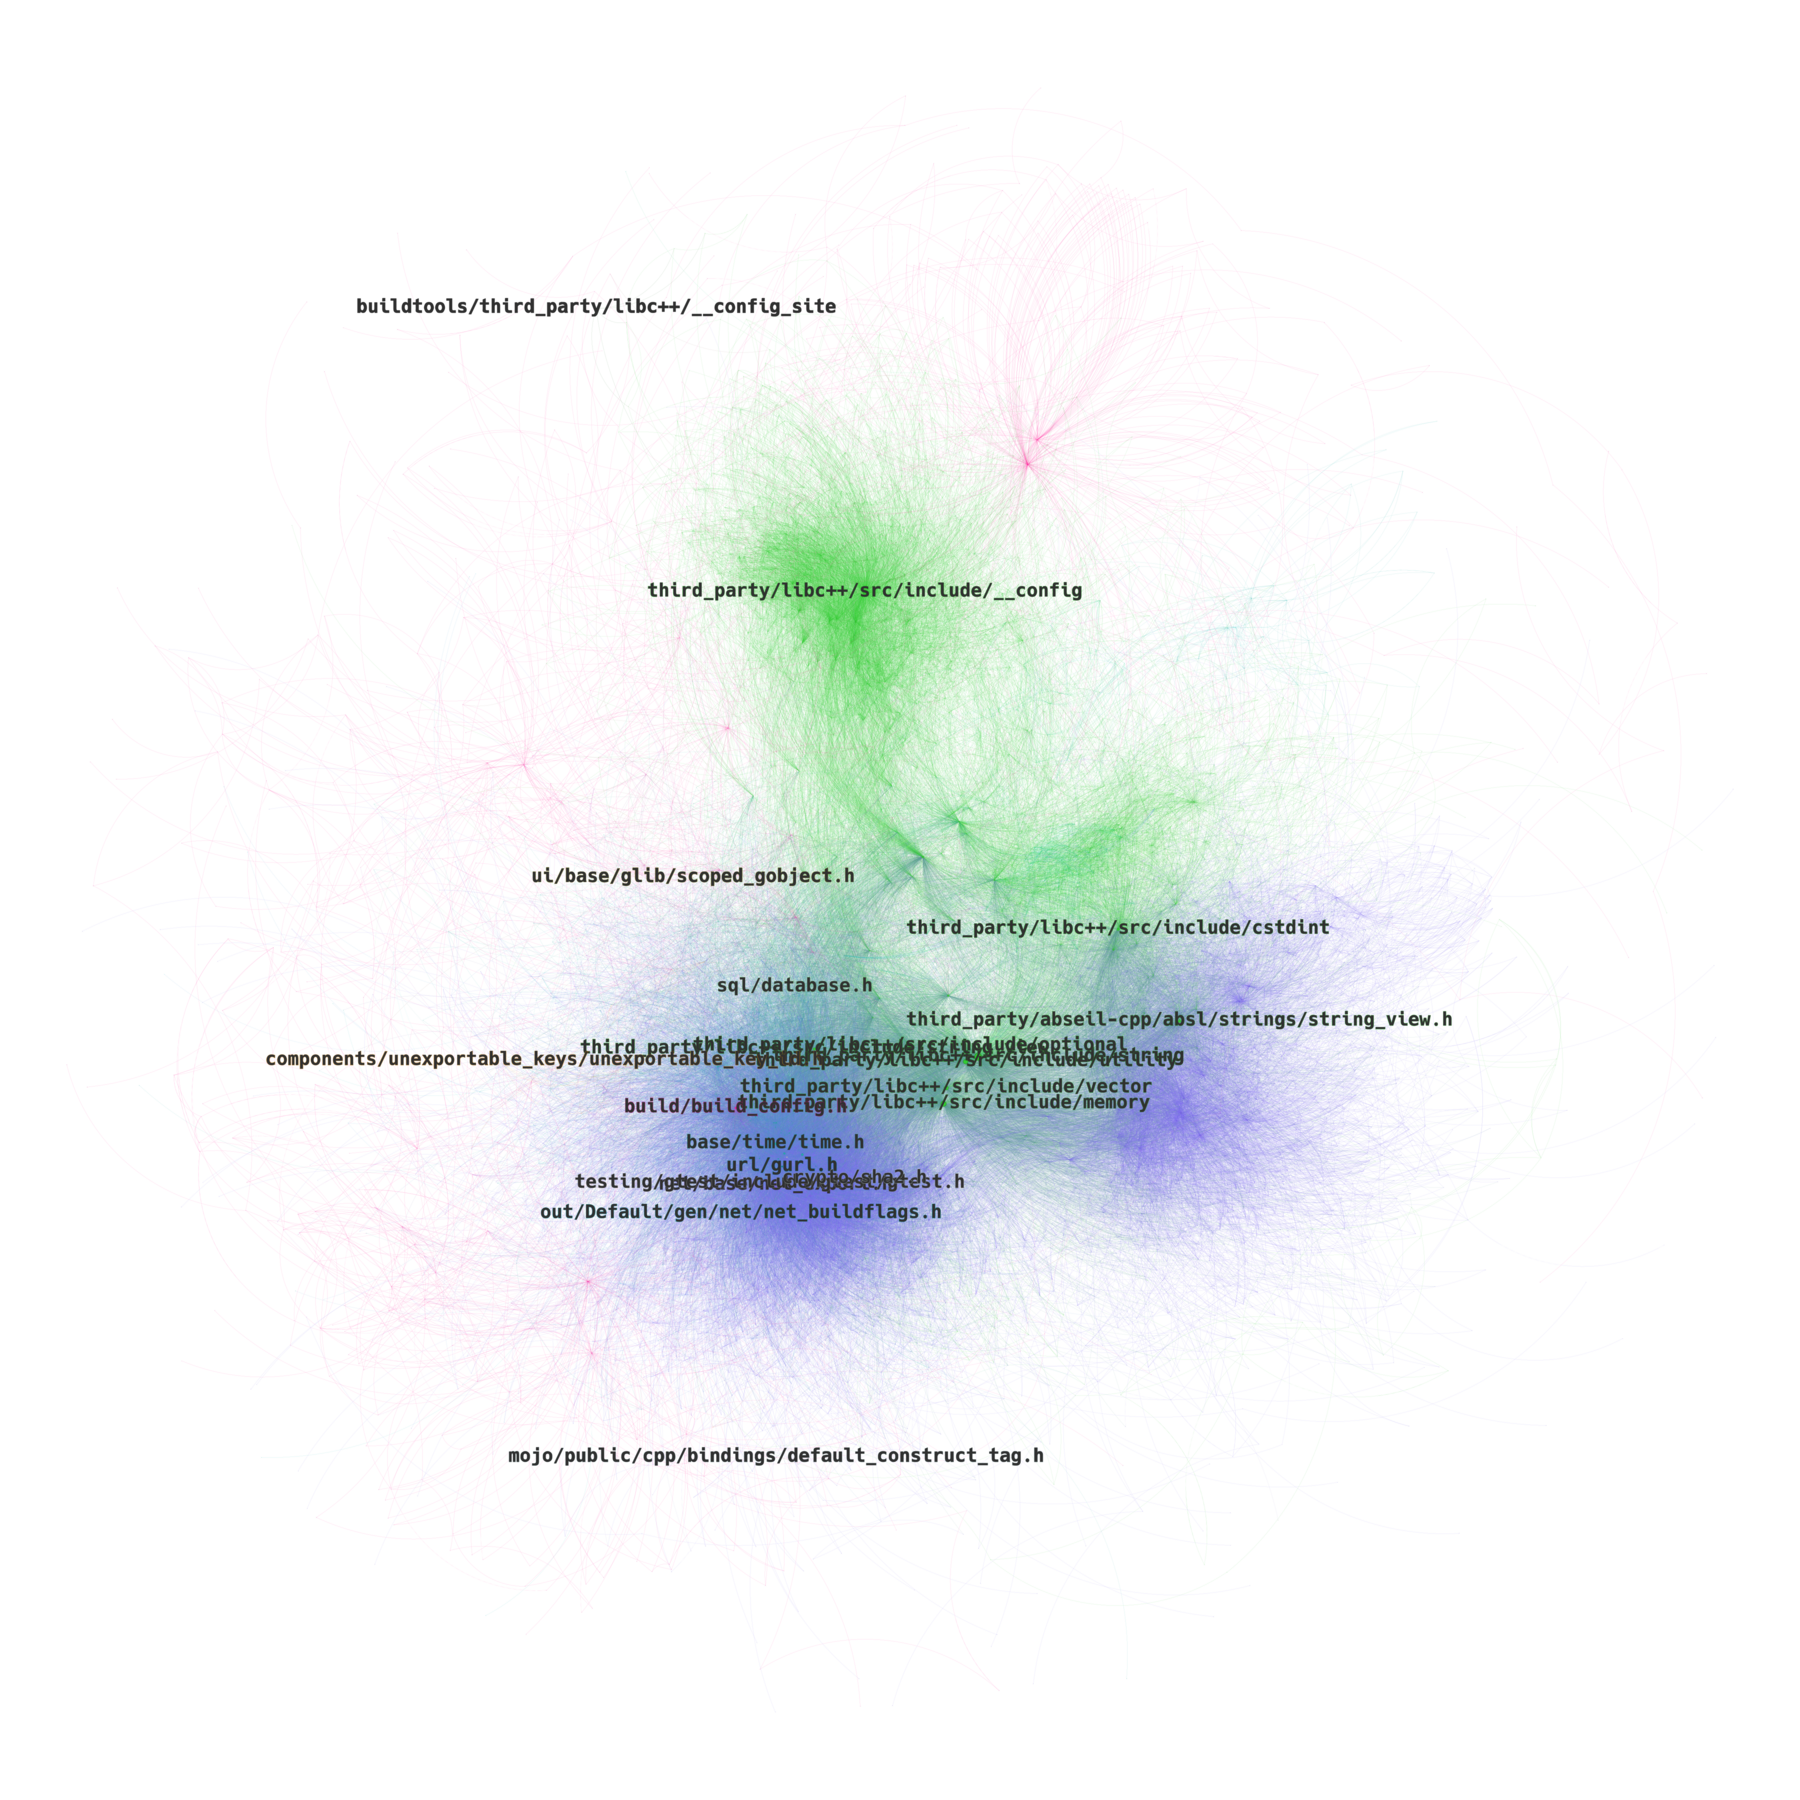
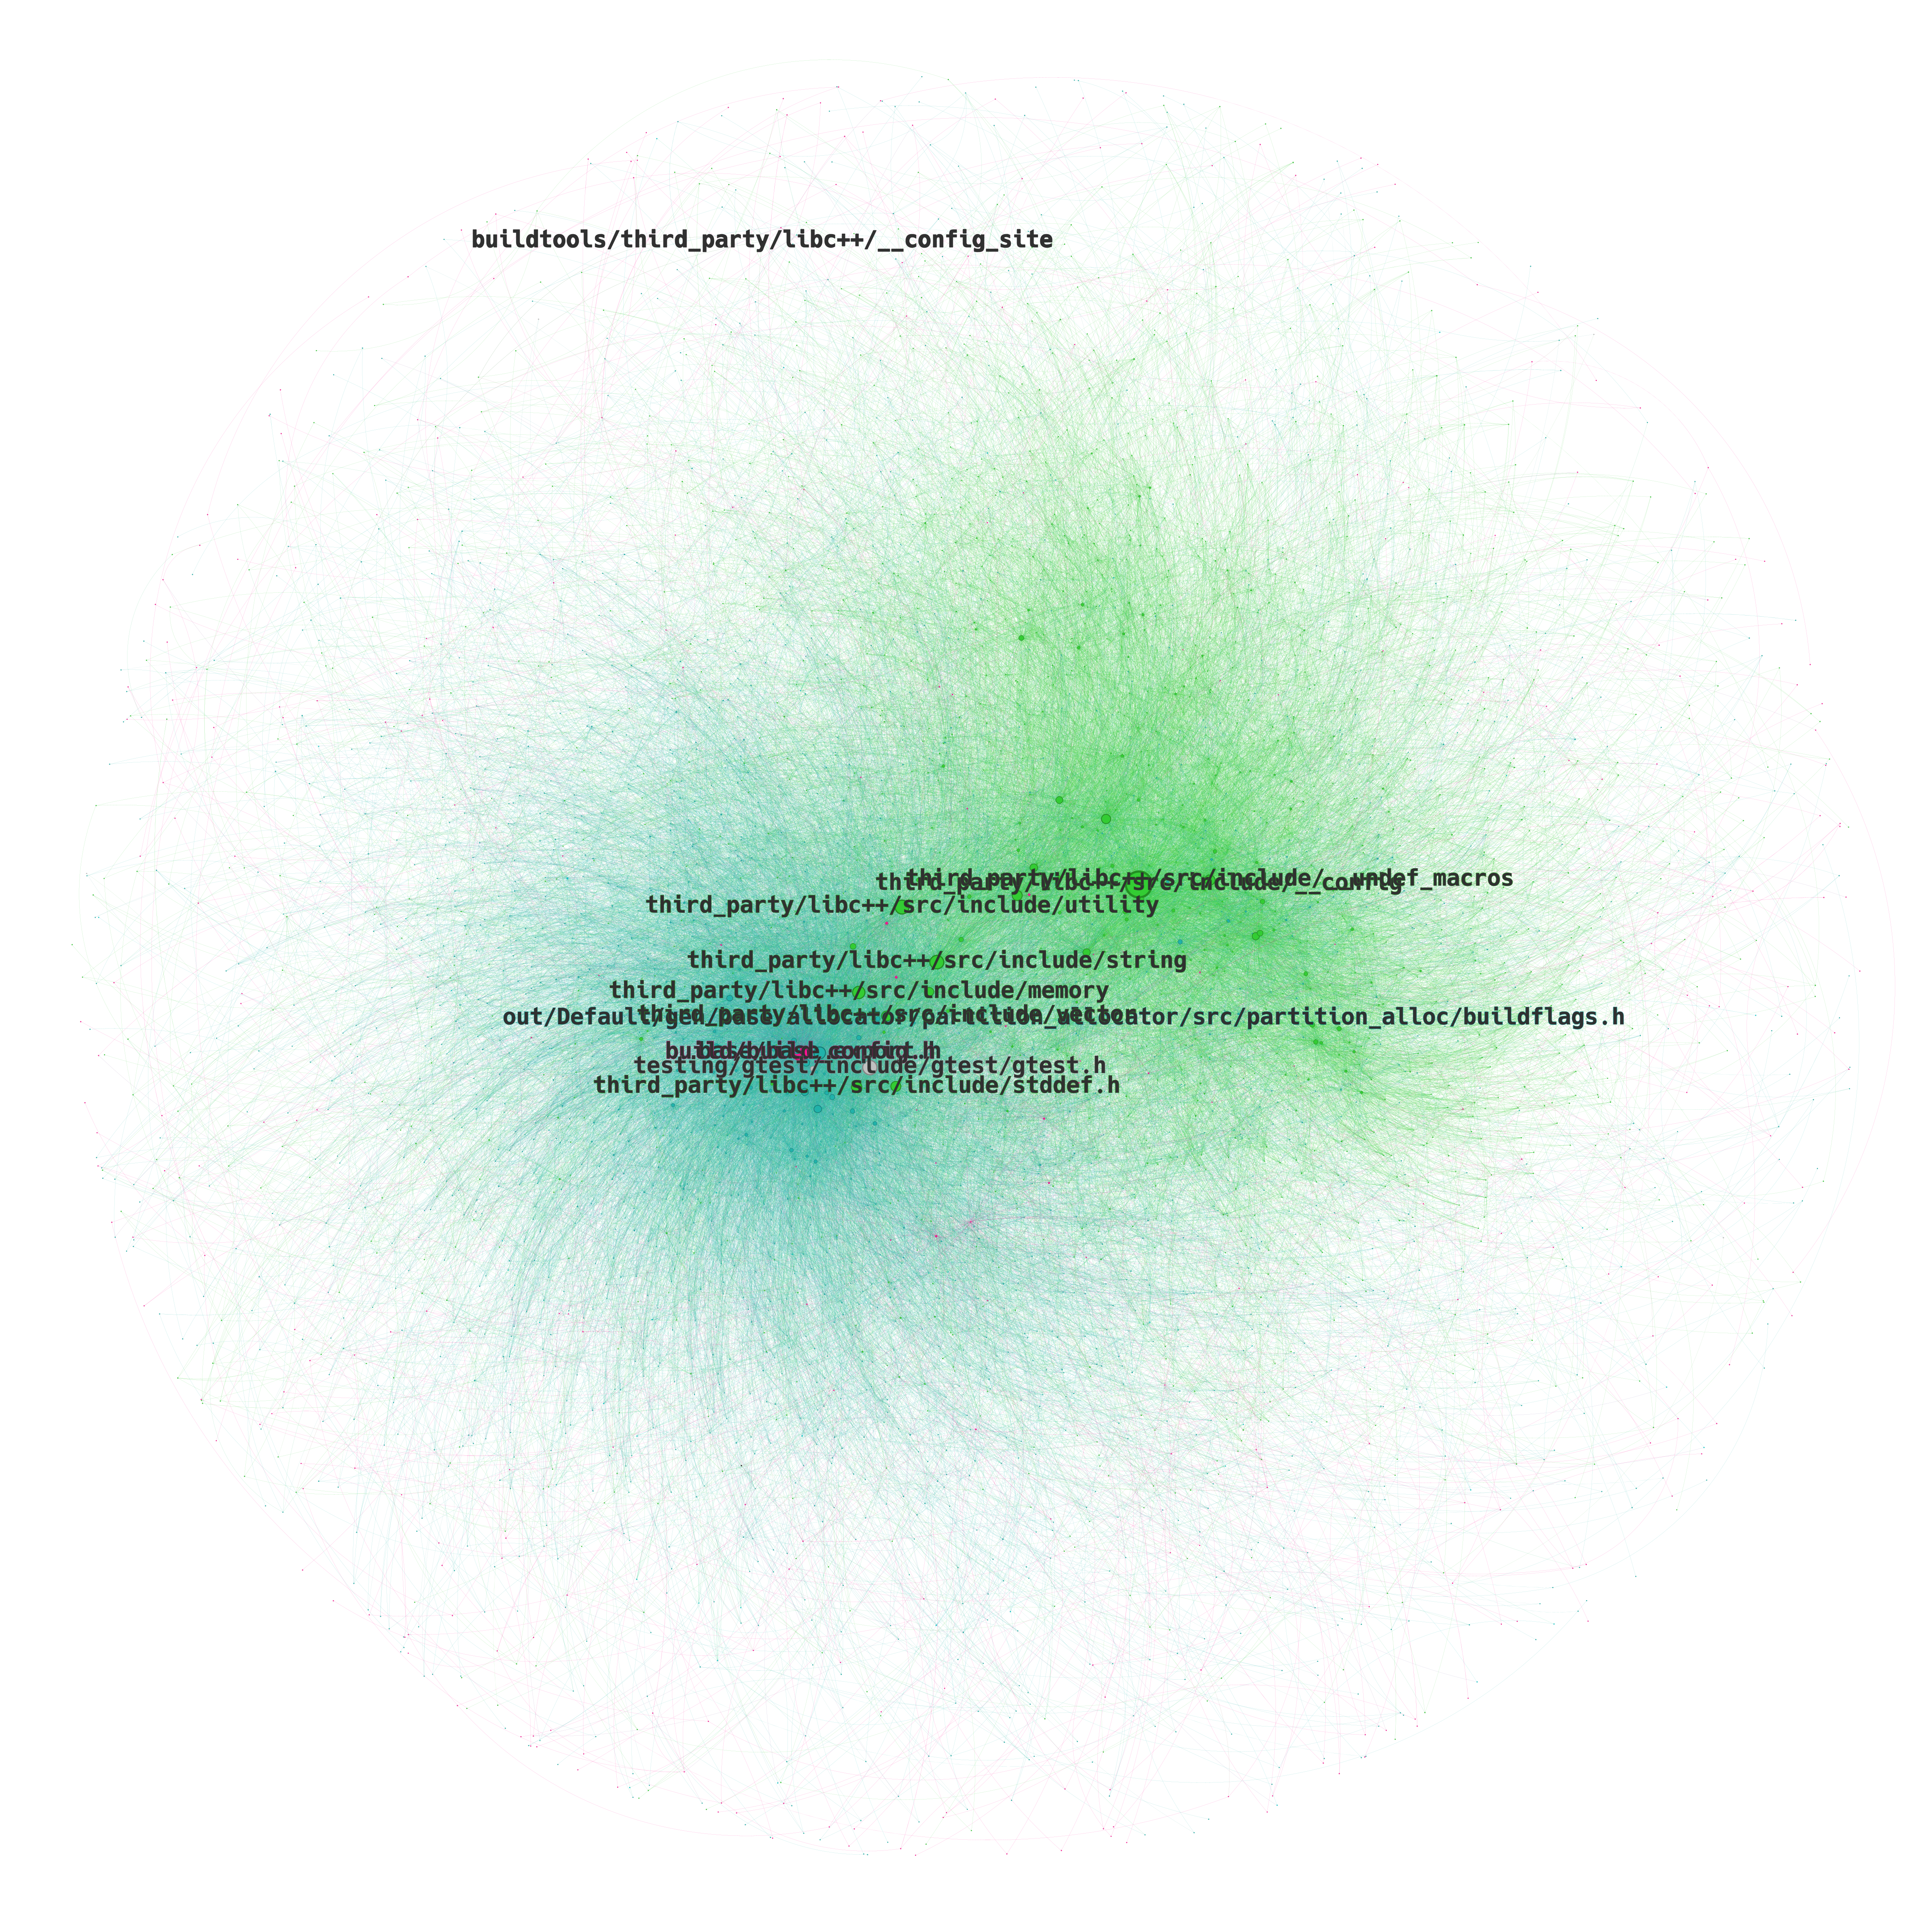
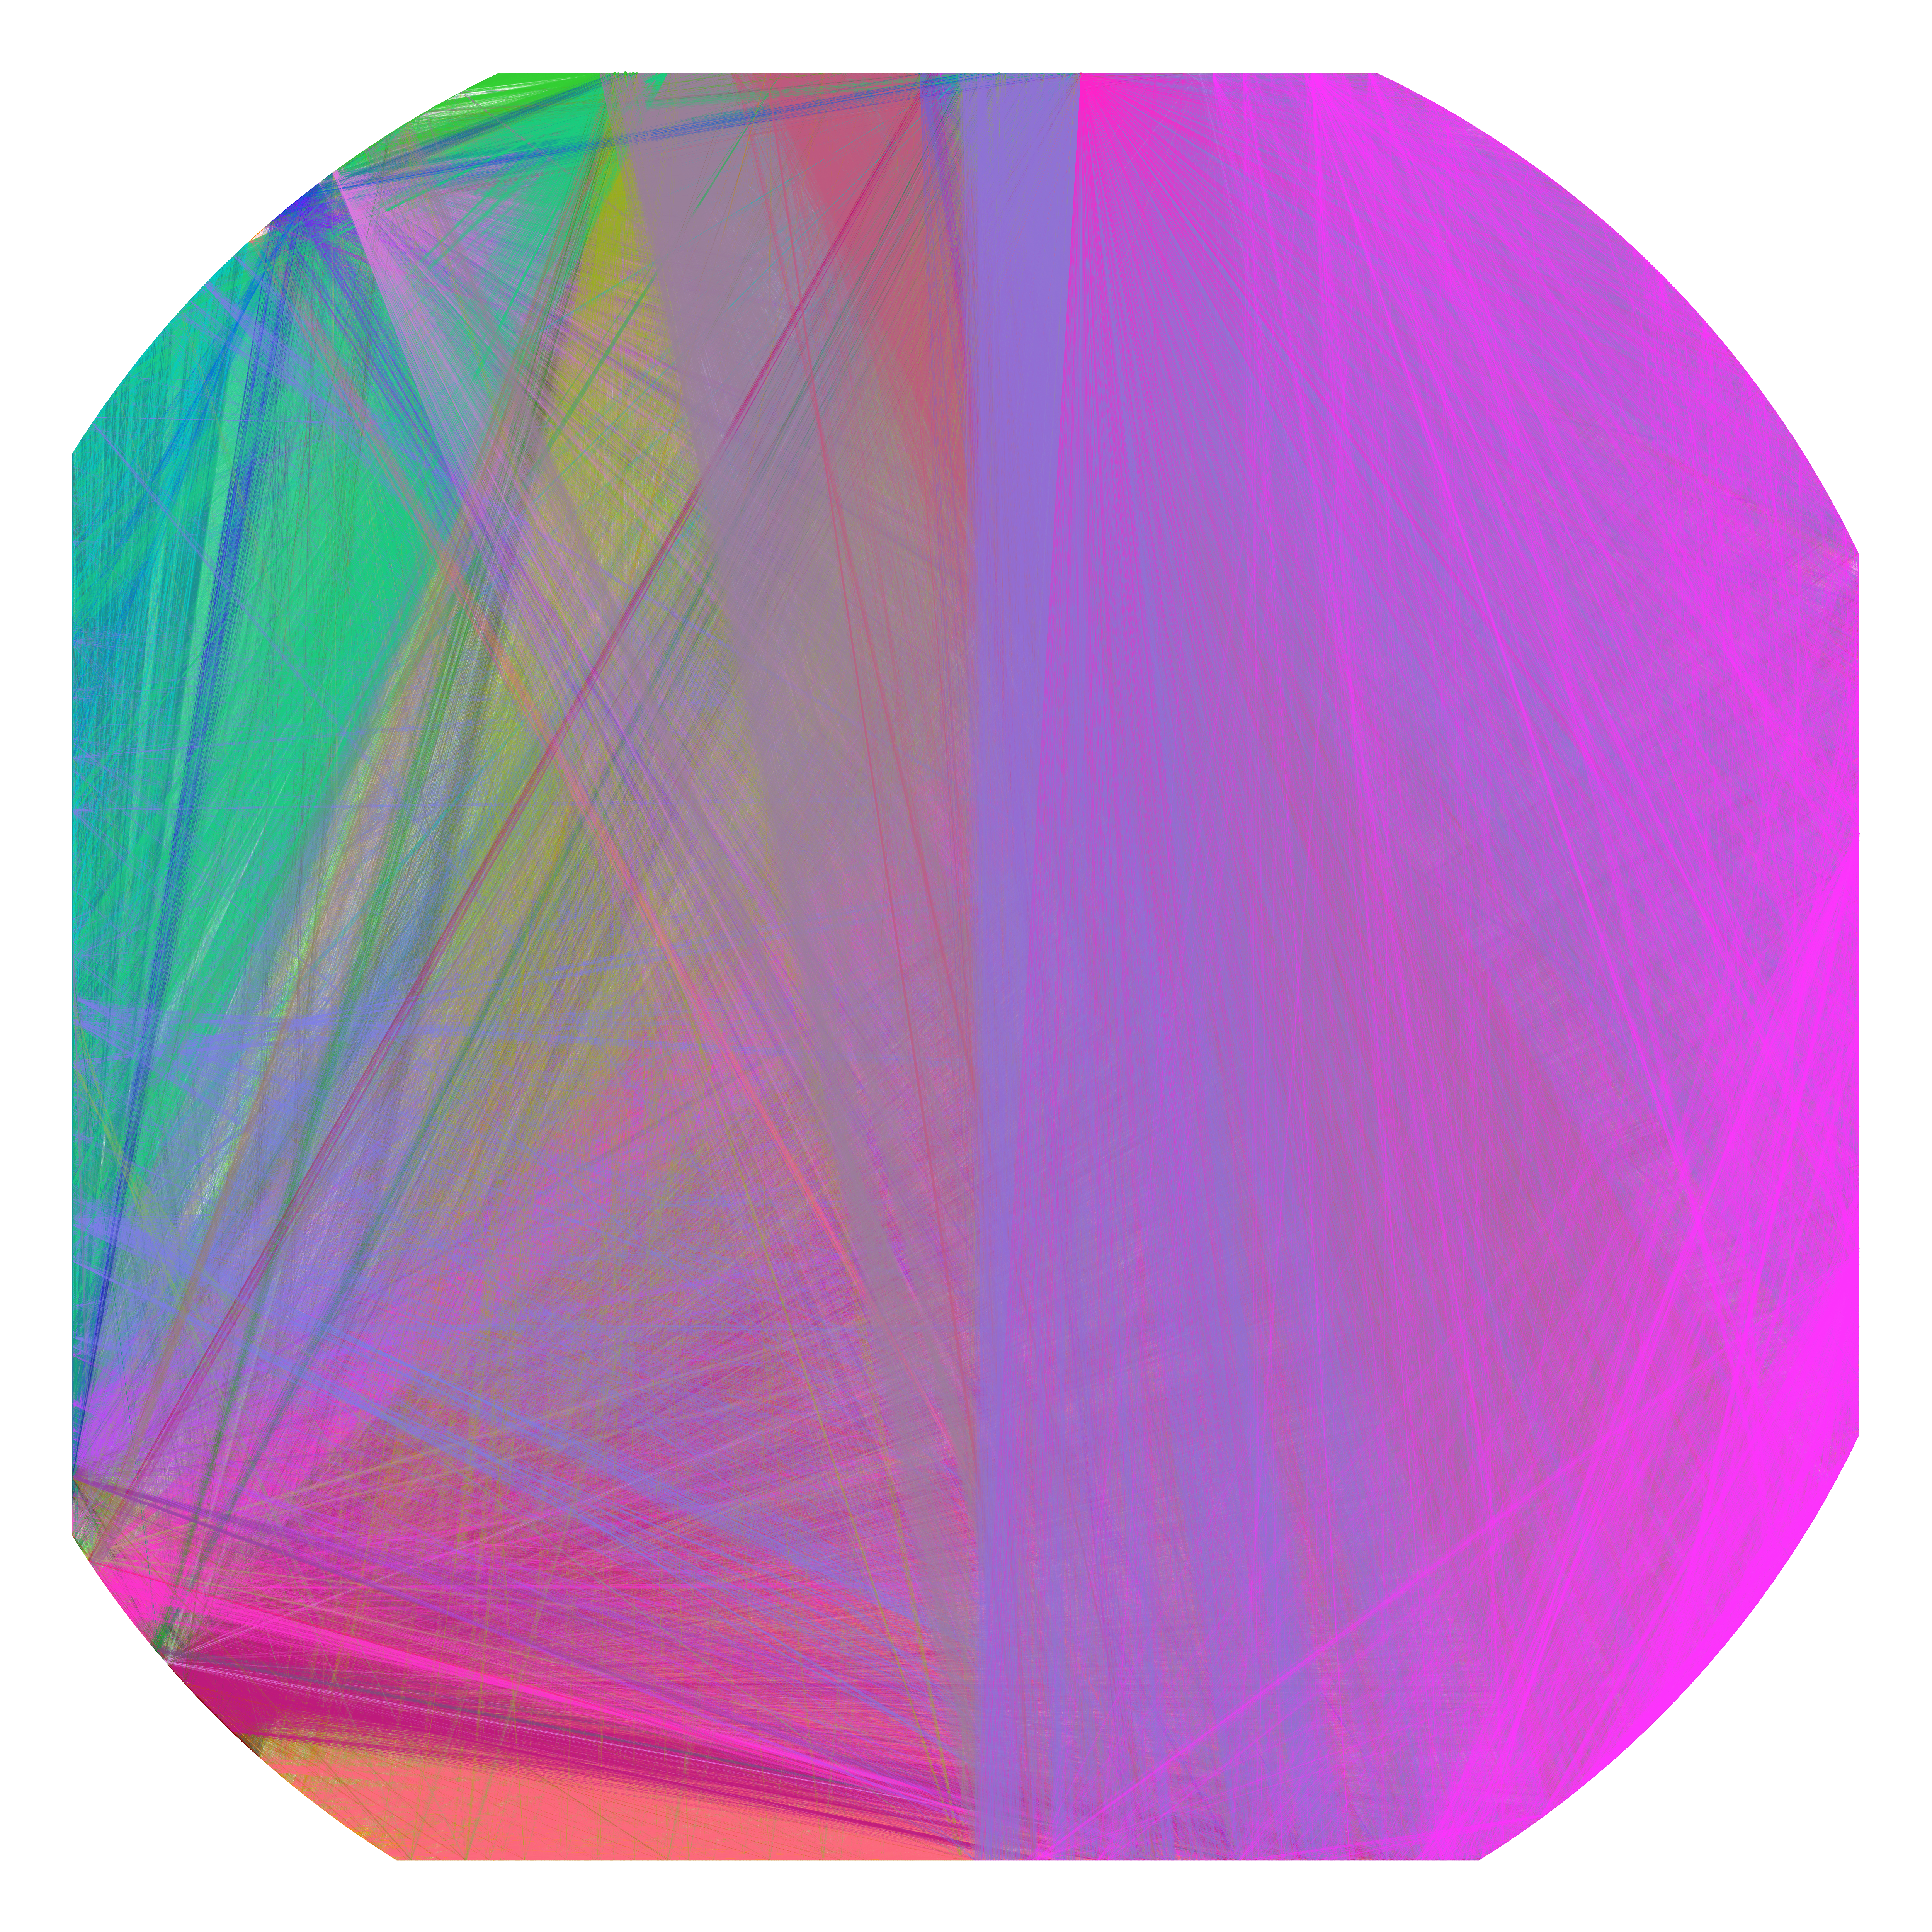
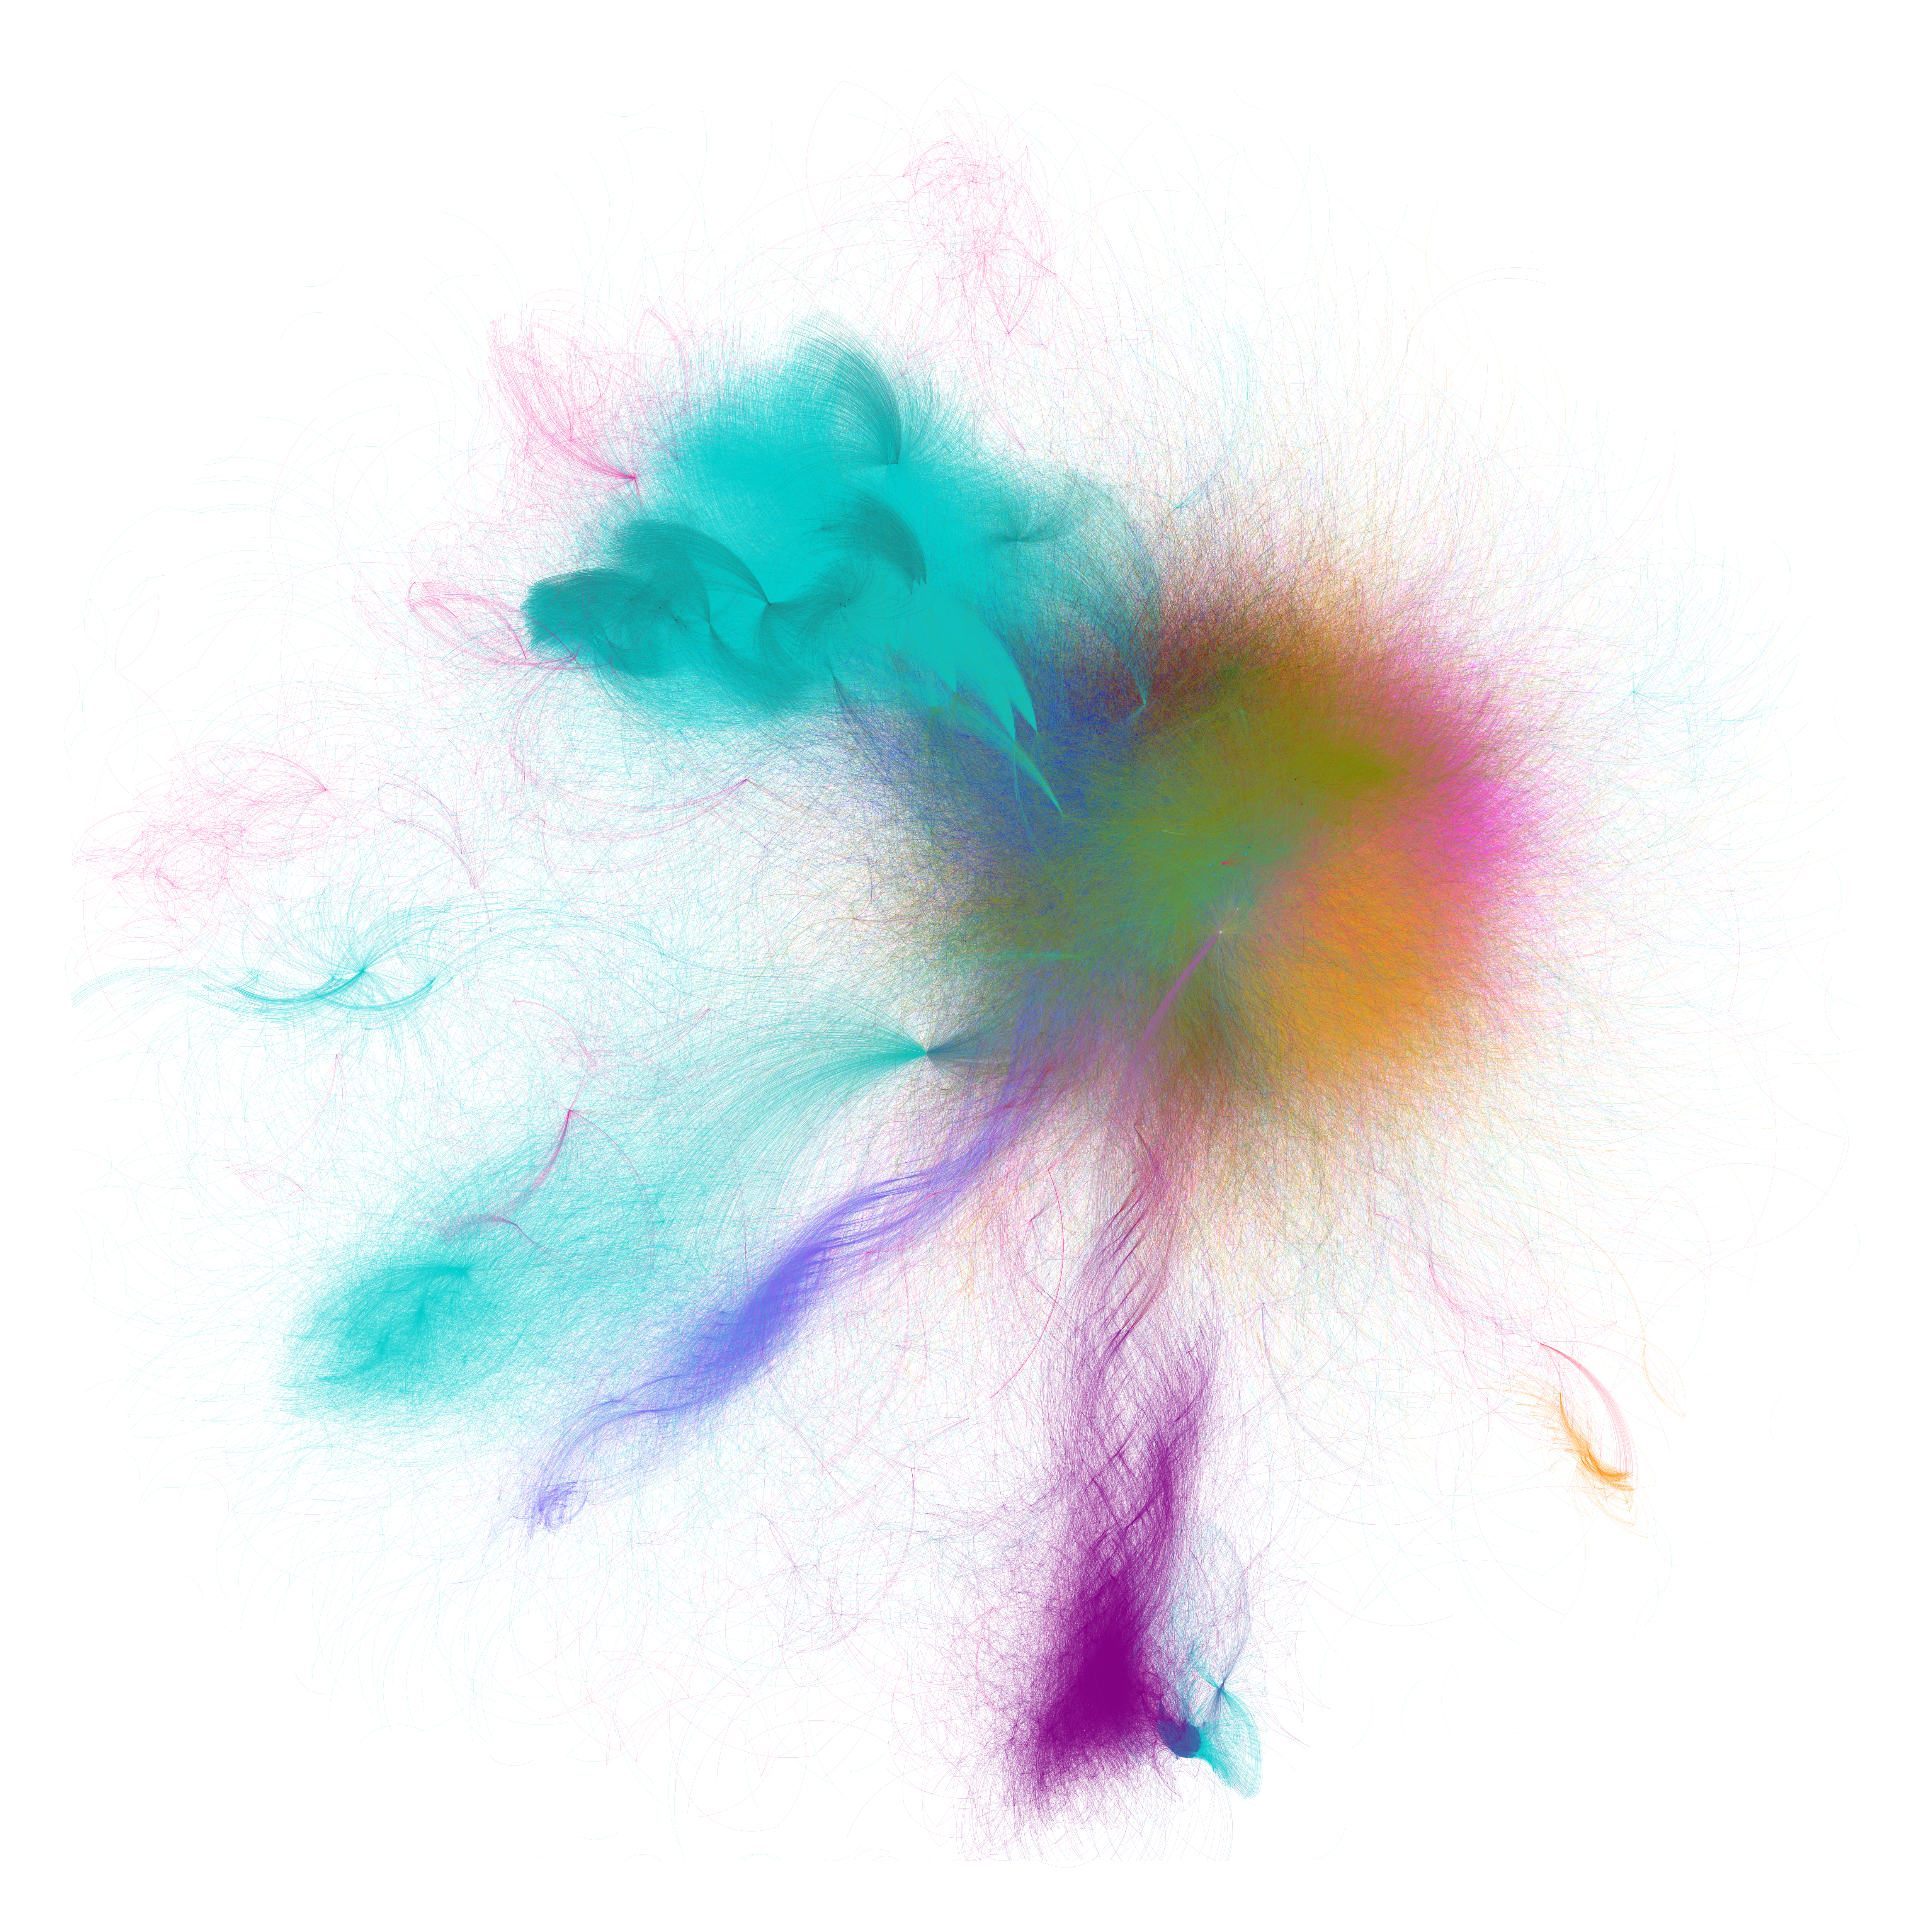
That’s what it looks like up close in the center of the big cluster (keep in mind - every node is a file, every edge is an #include directive):
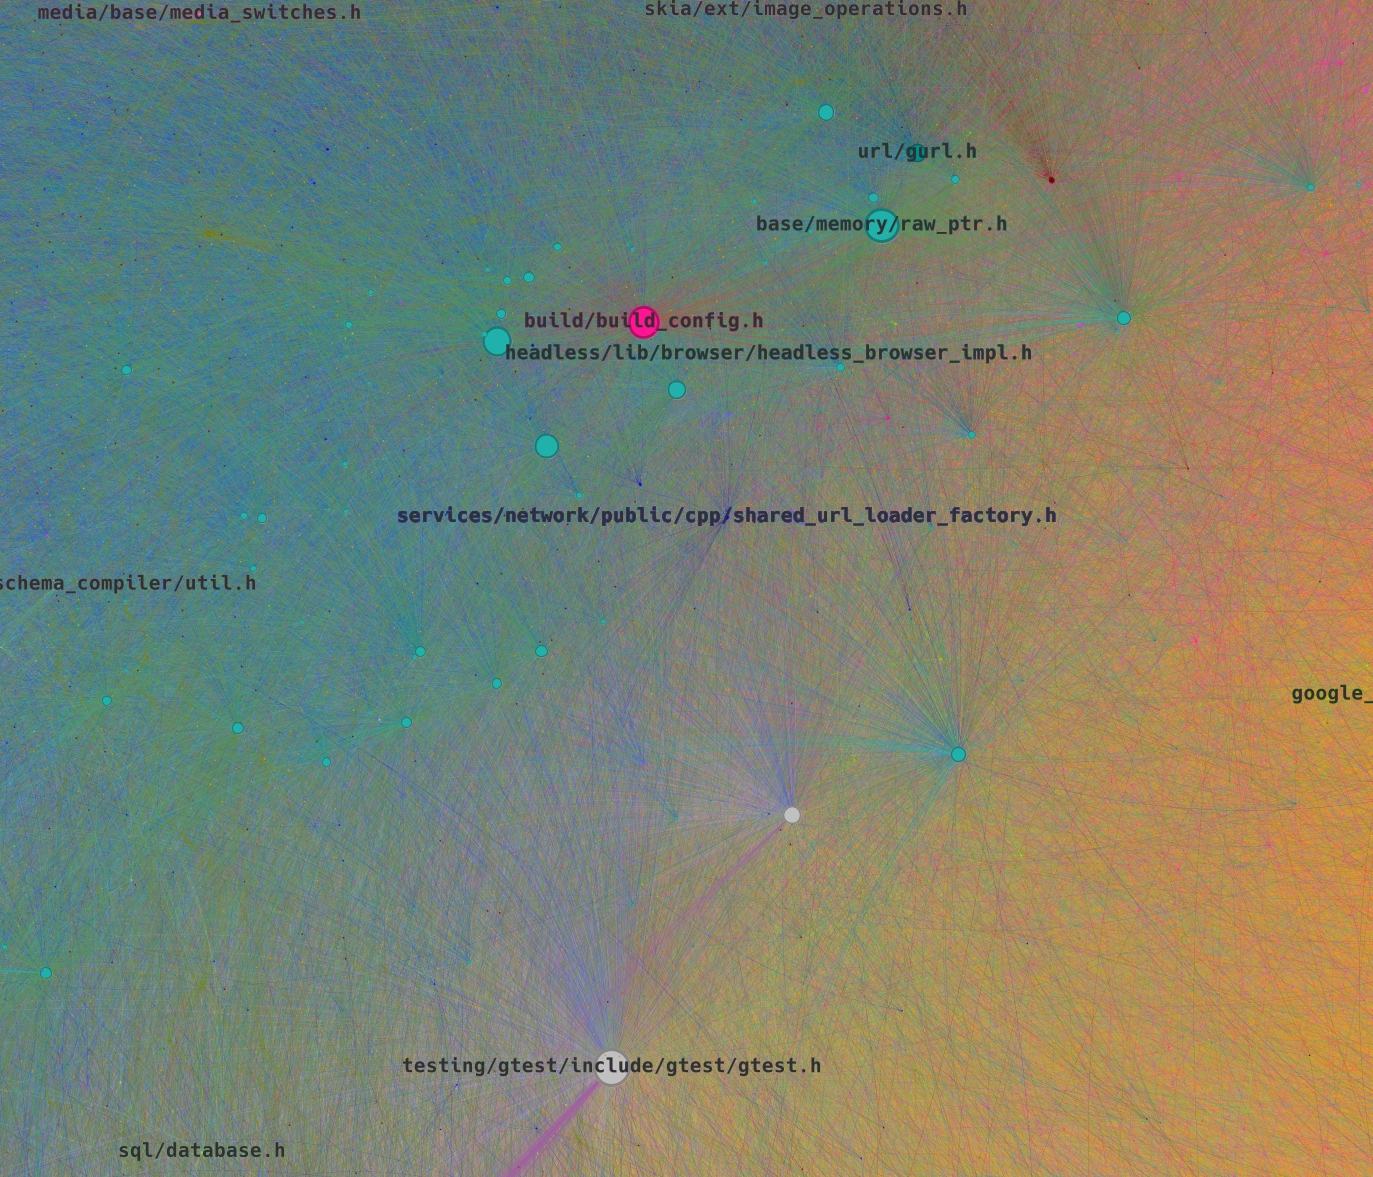
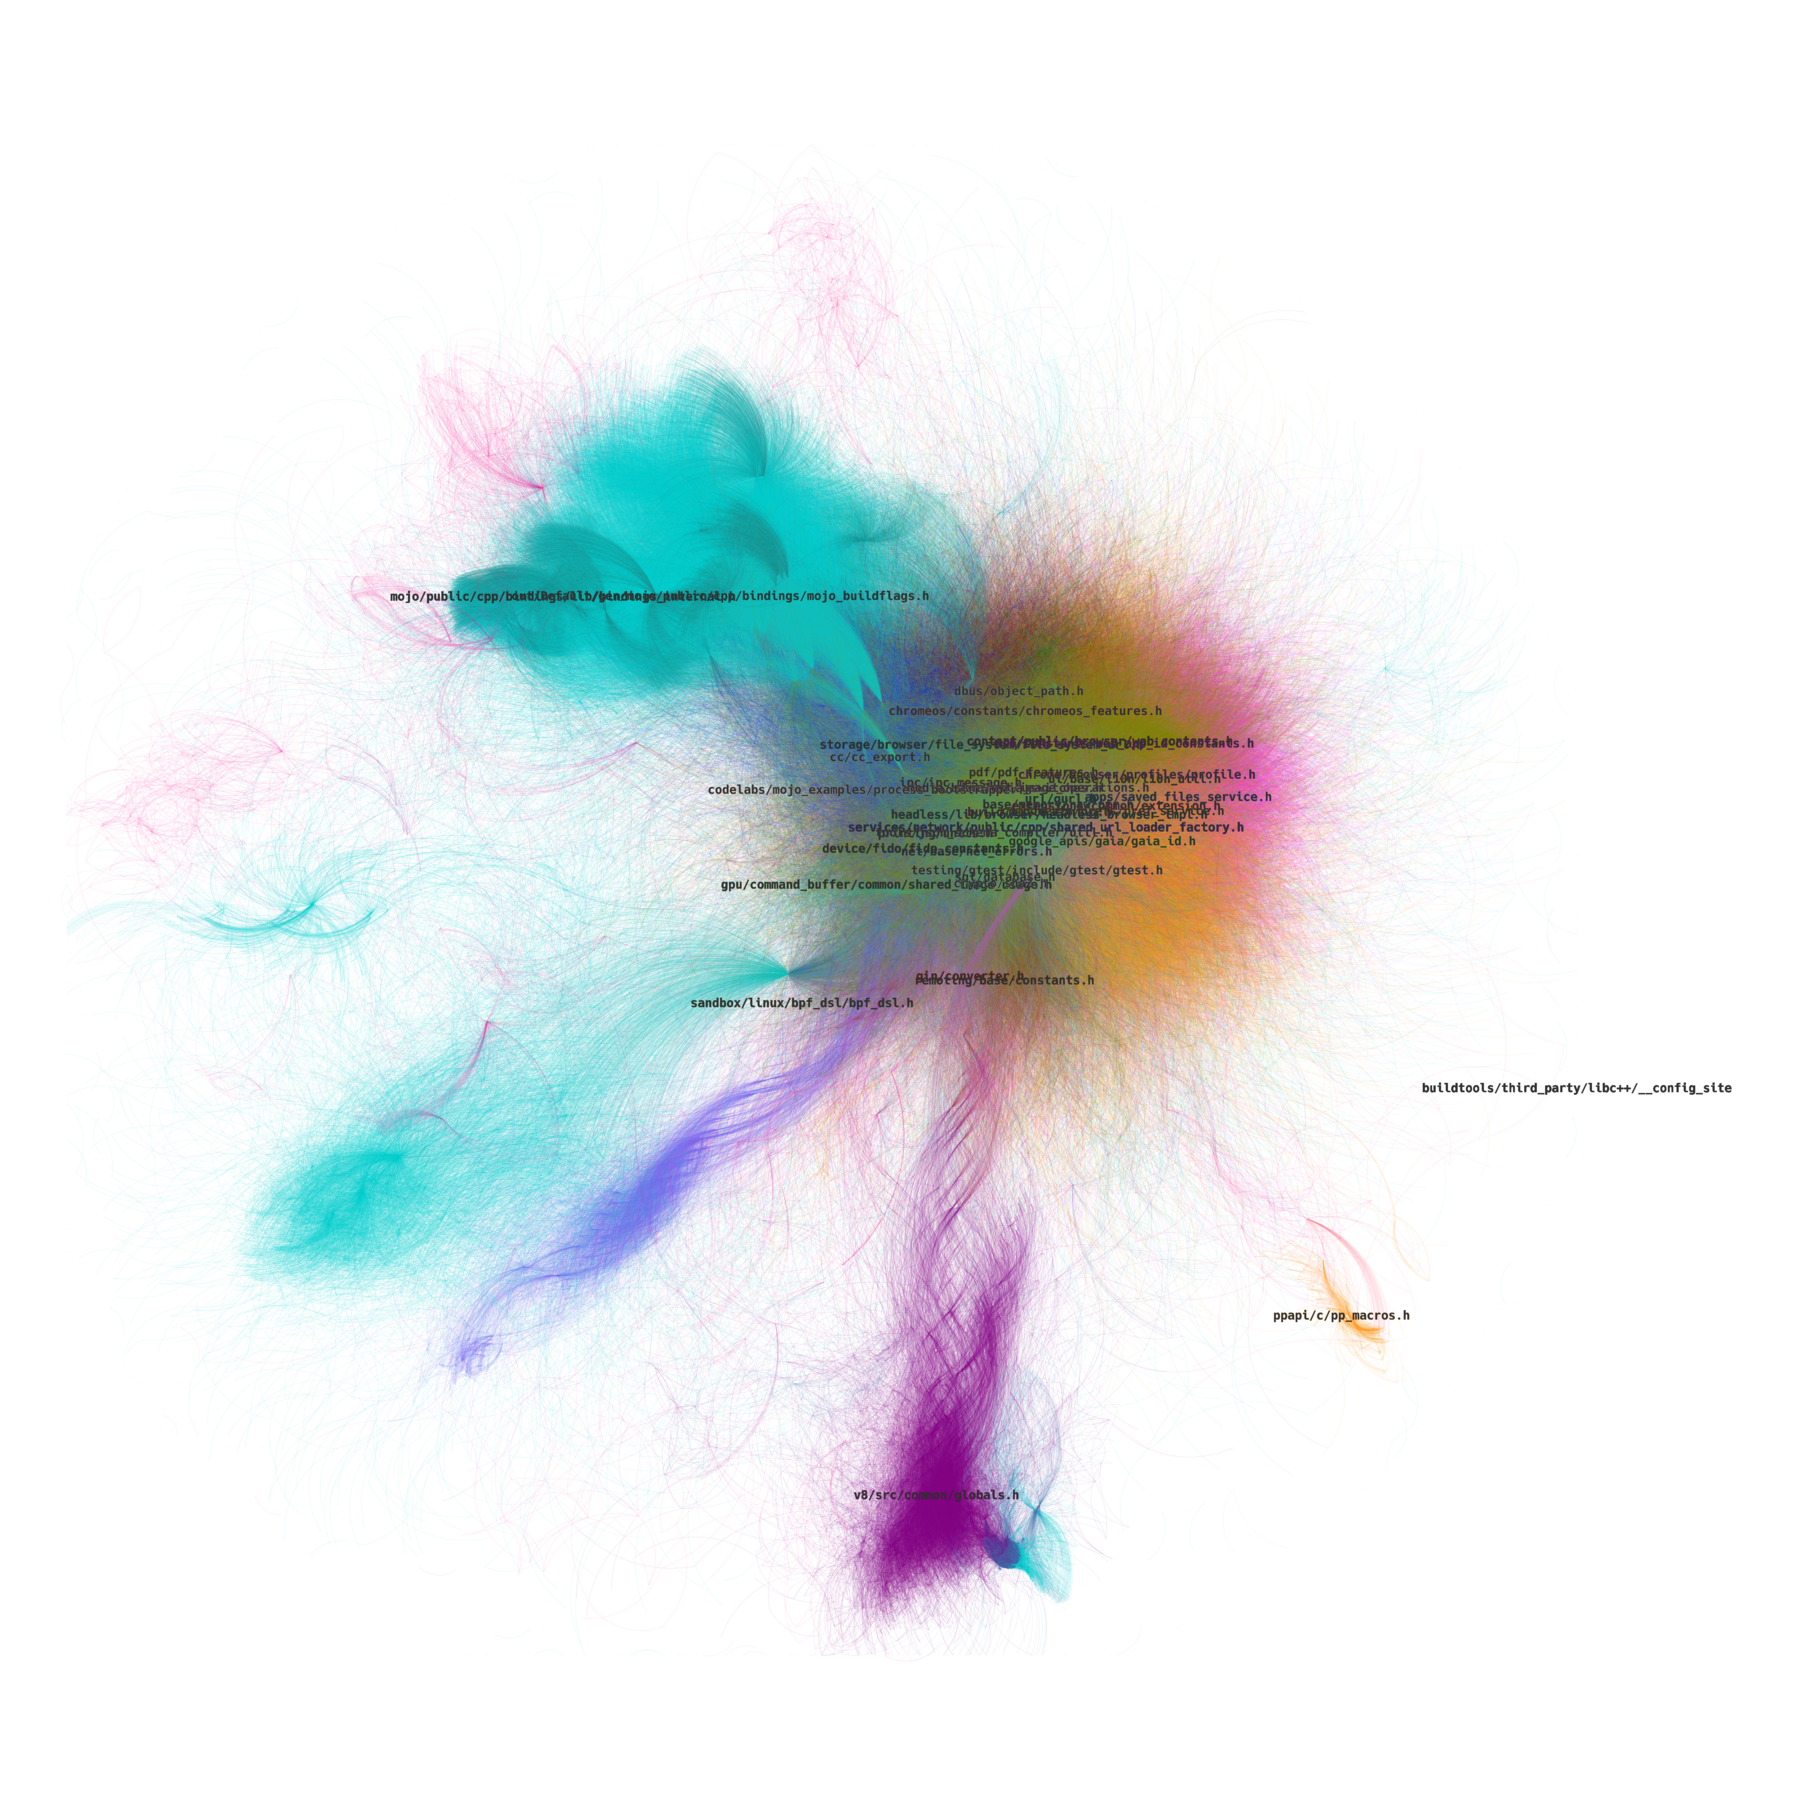
One interesting thing in the full diagram is, that while most of the edges seem to be mostly randomly organized within their clusters, there is a teal formation in the upper left that seems to be much more structured than the rest:
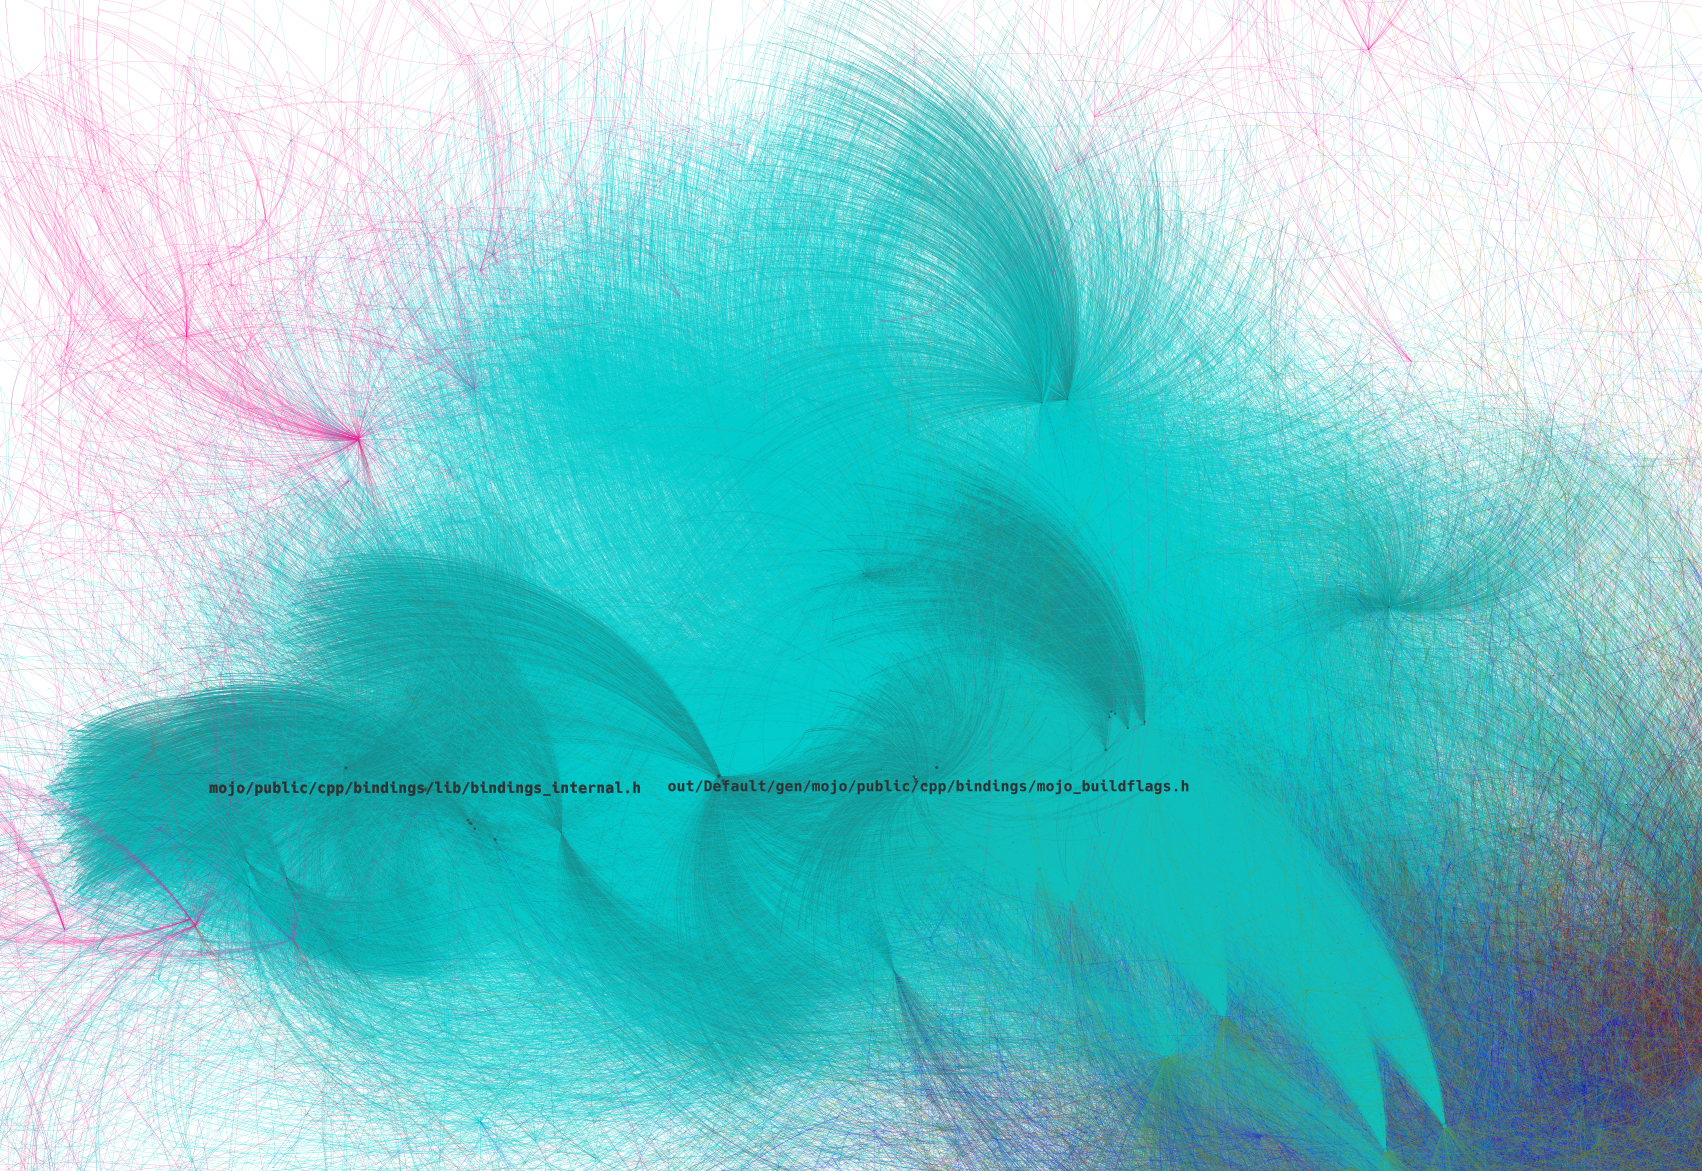
It turns out, these are includes from the out (light teal) and mojo (dark teal) subdirectories, which contain all kinds of automatically generated code (Protobuf, Mojo, etc.), and apparently such headers are much more organized then those written and managed by humans (I assume here that most of Chromium is still written by human developers).
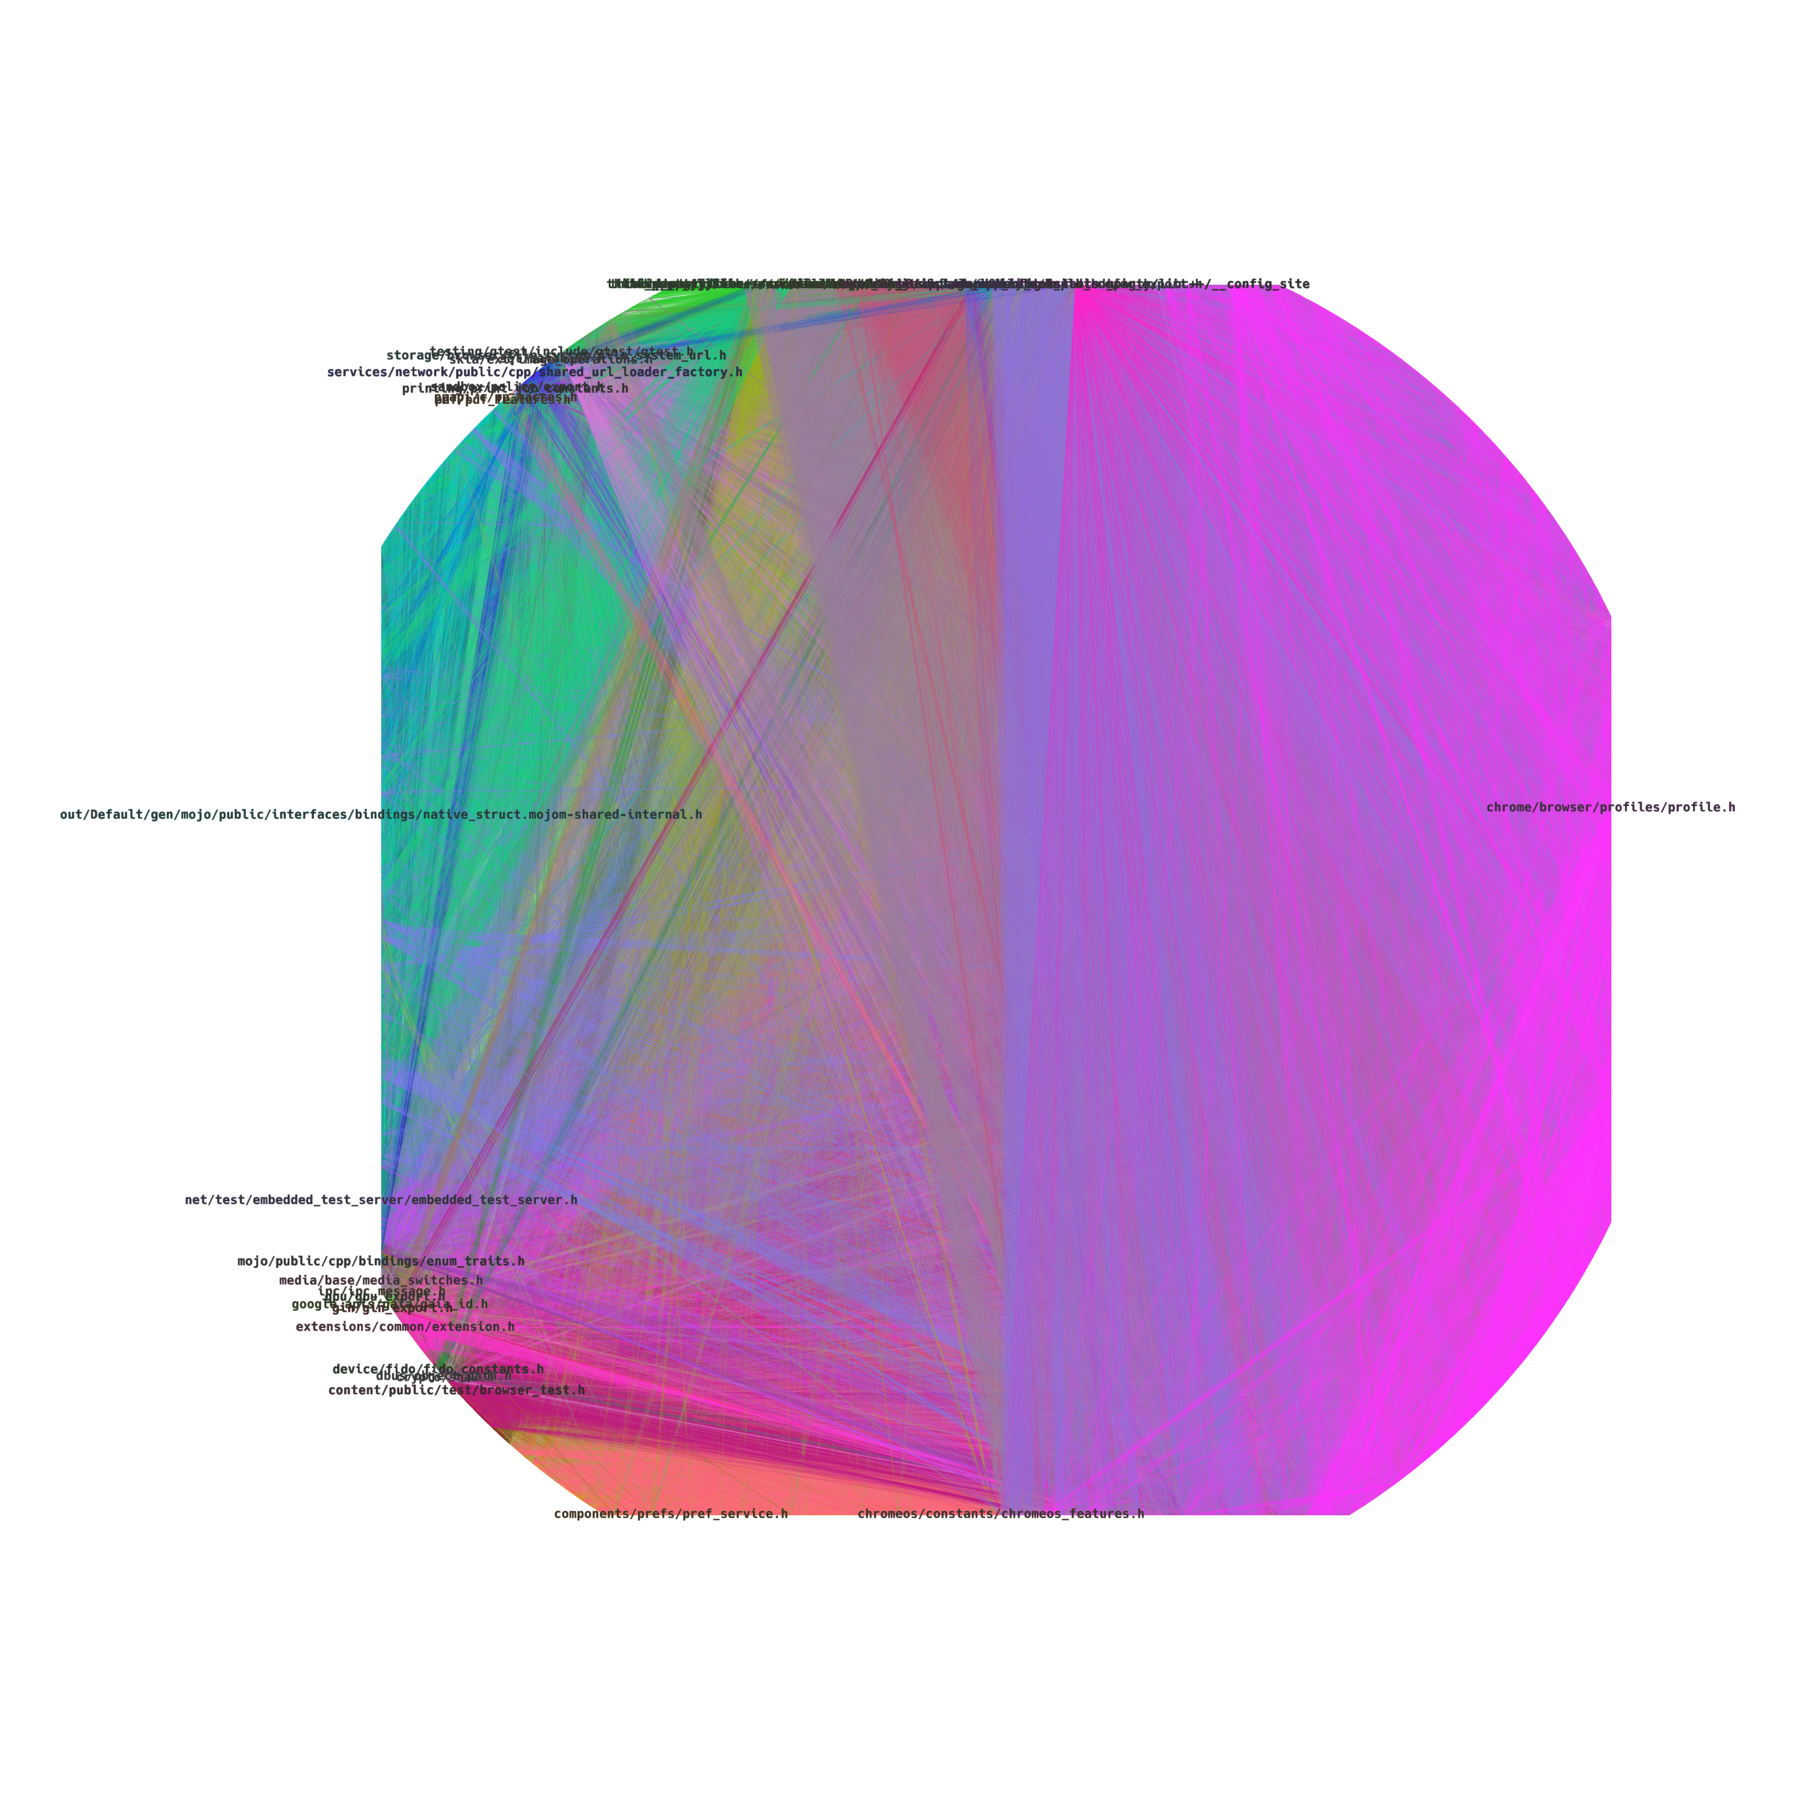
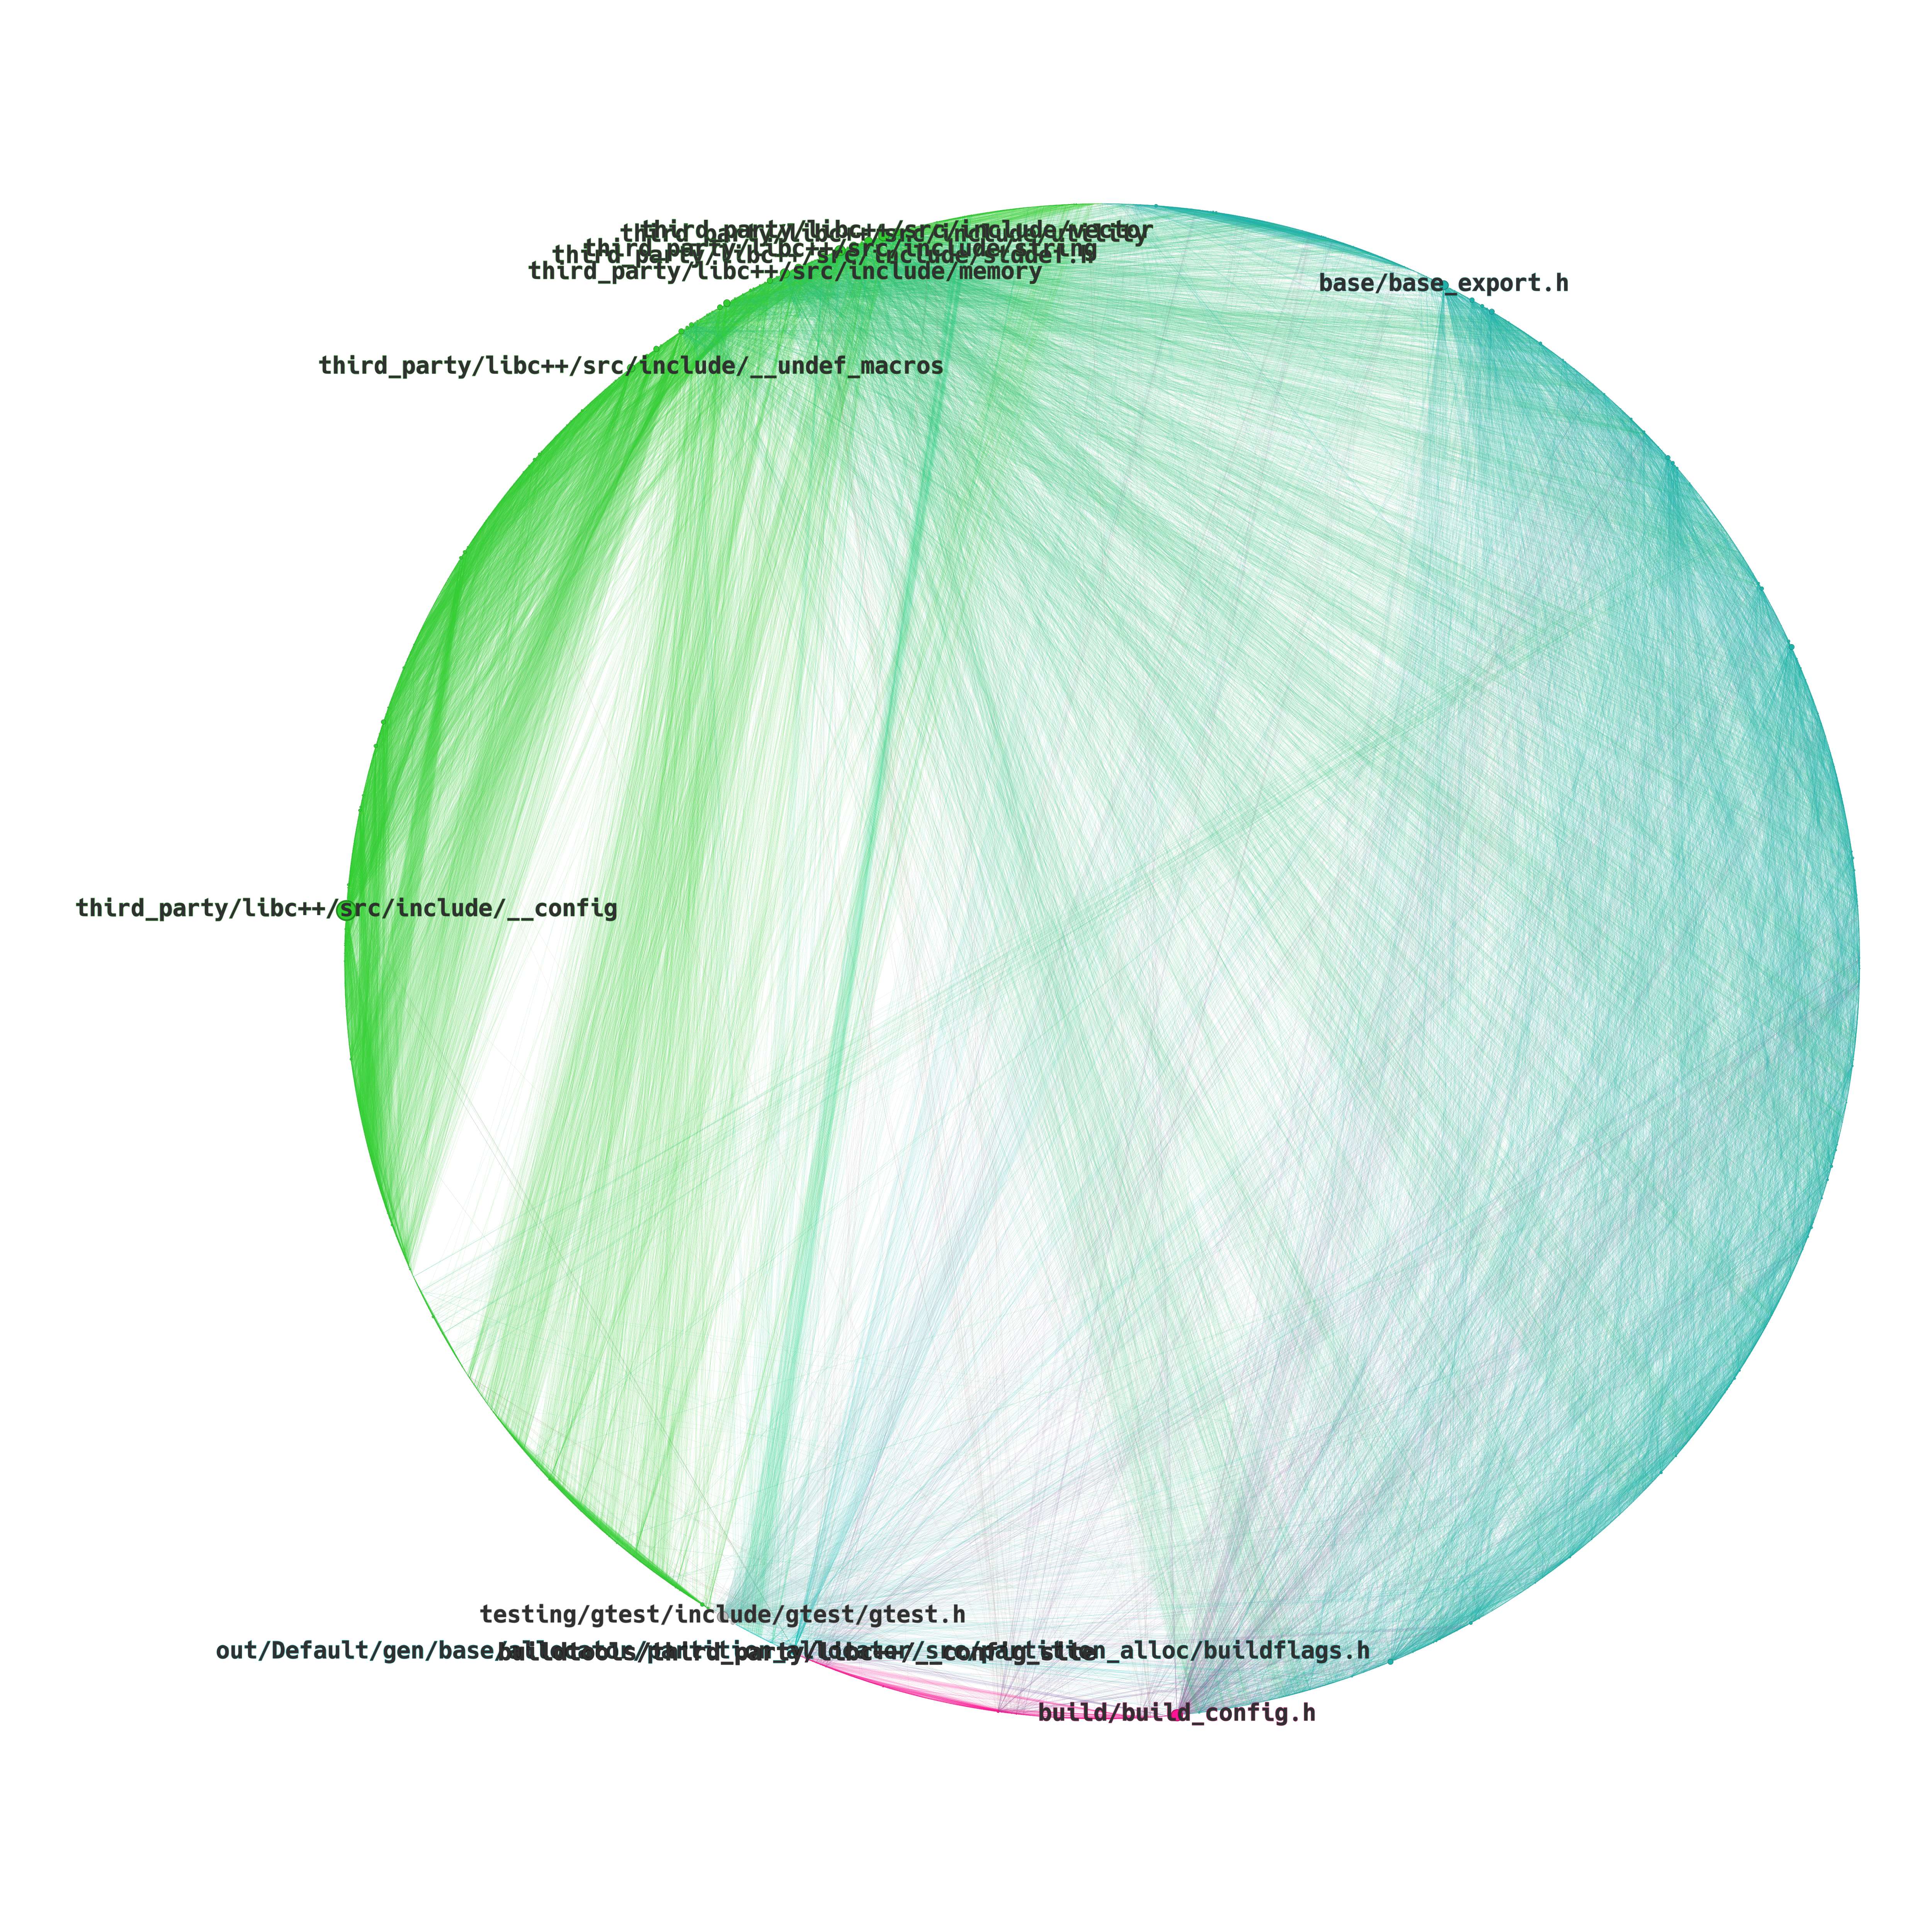
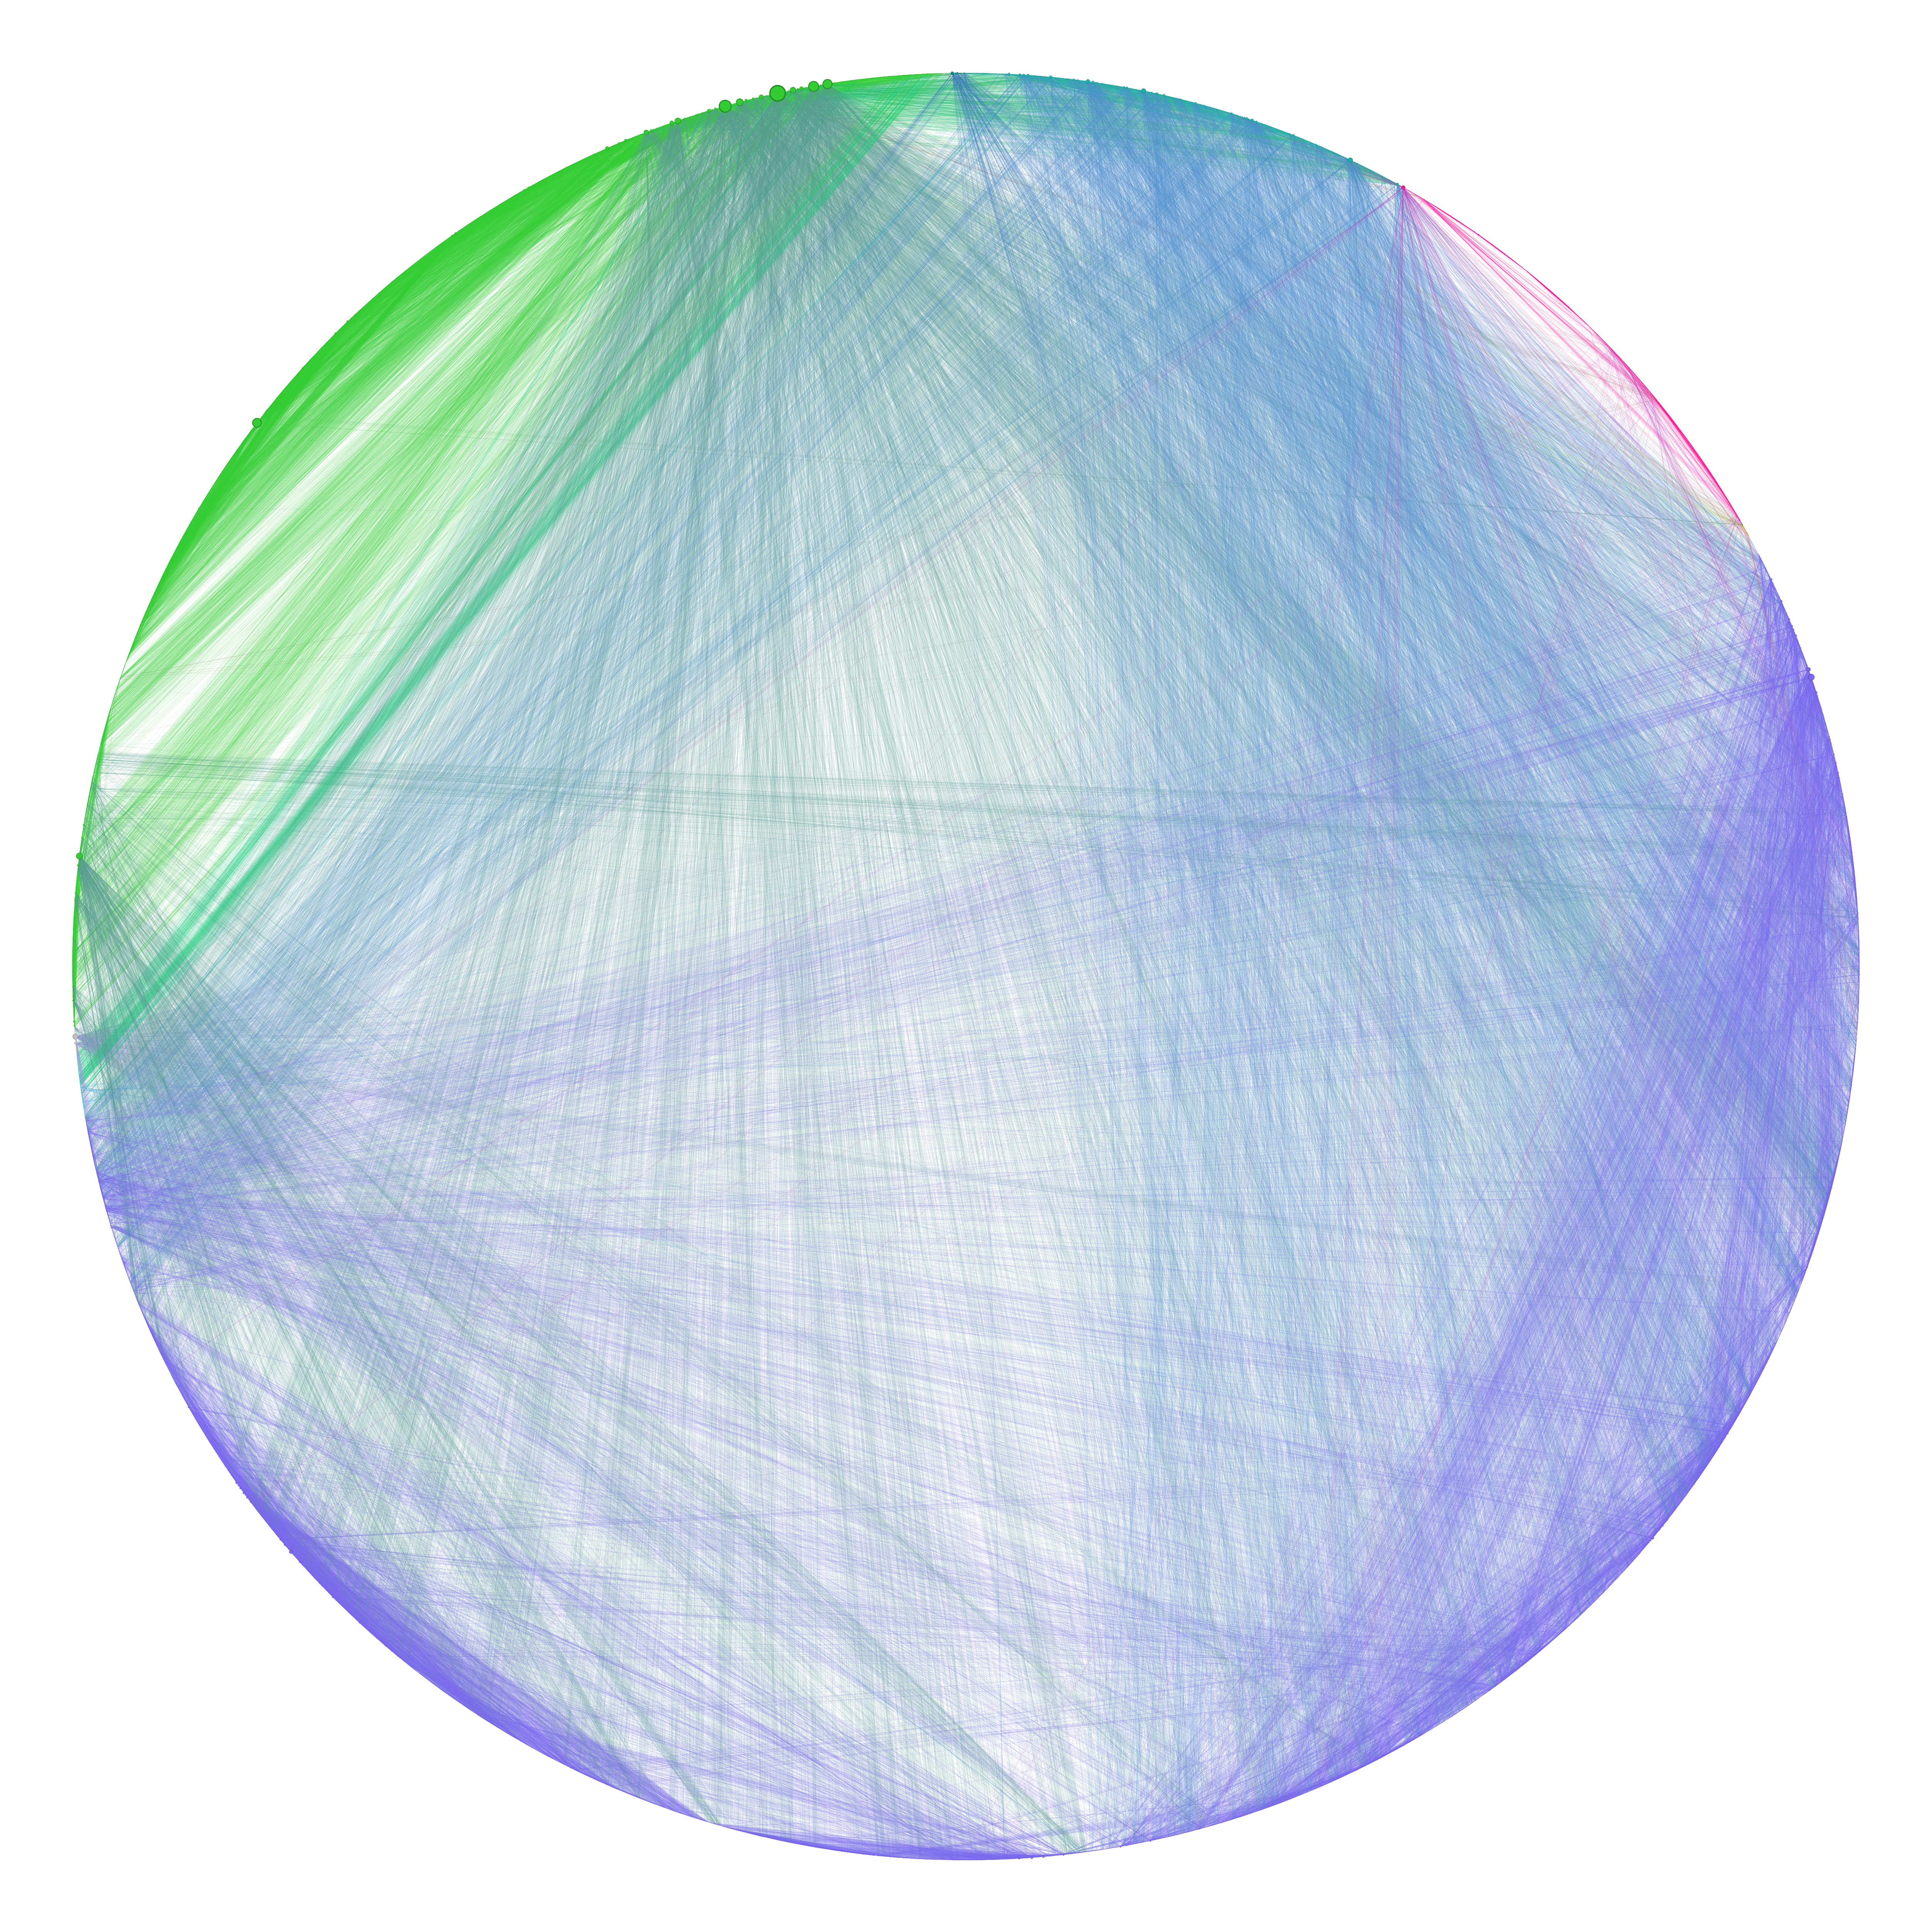
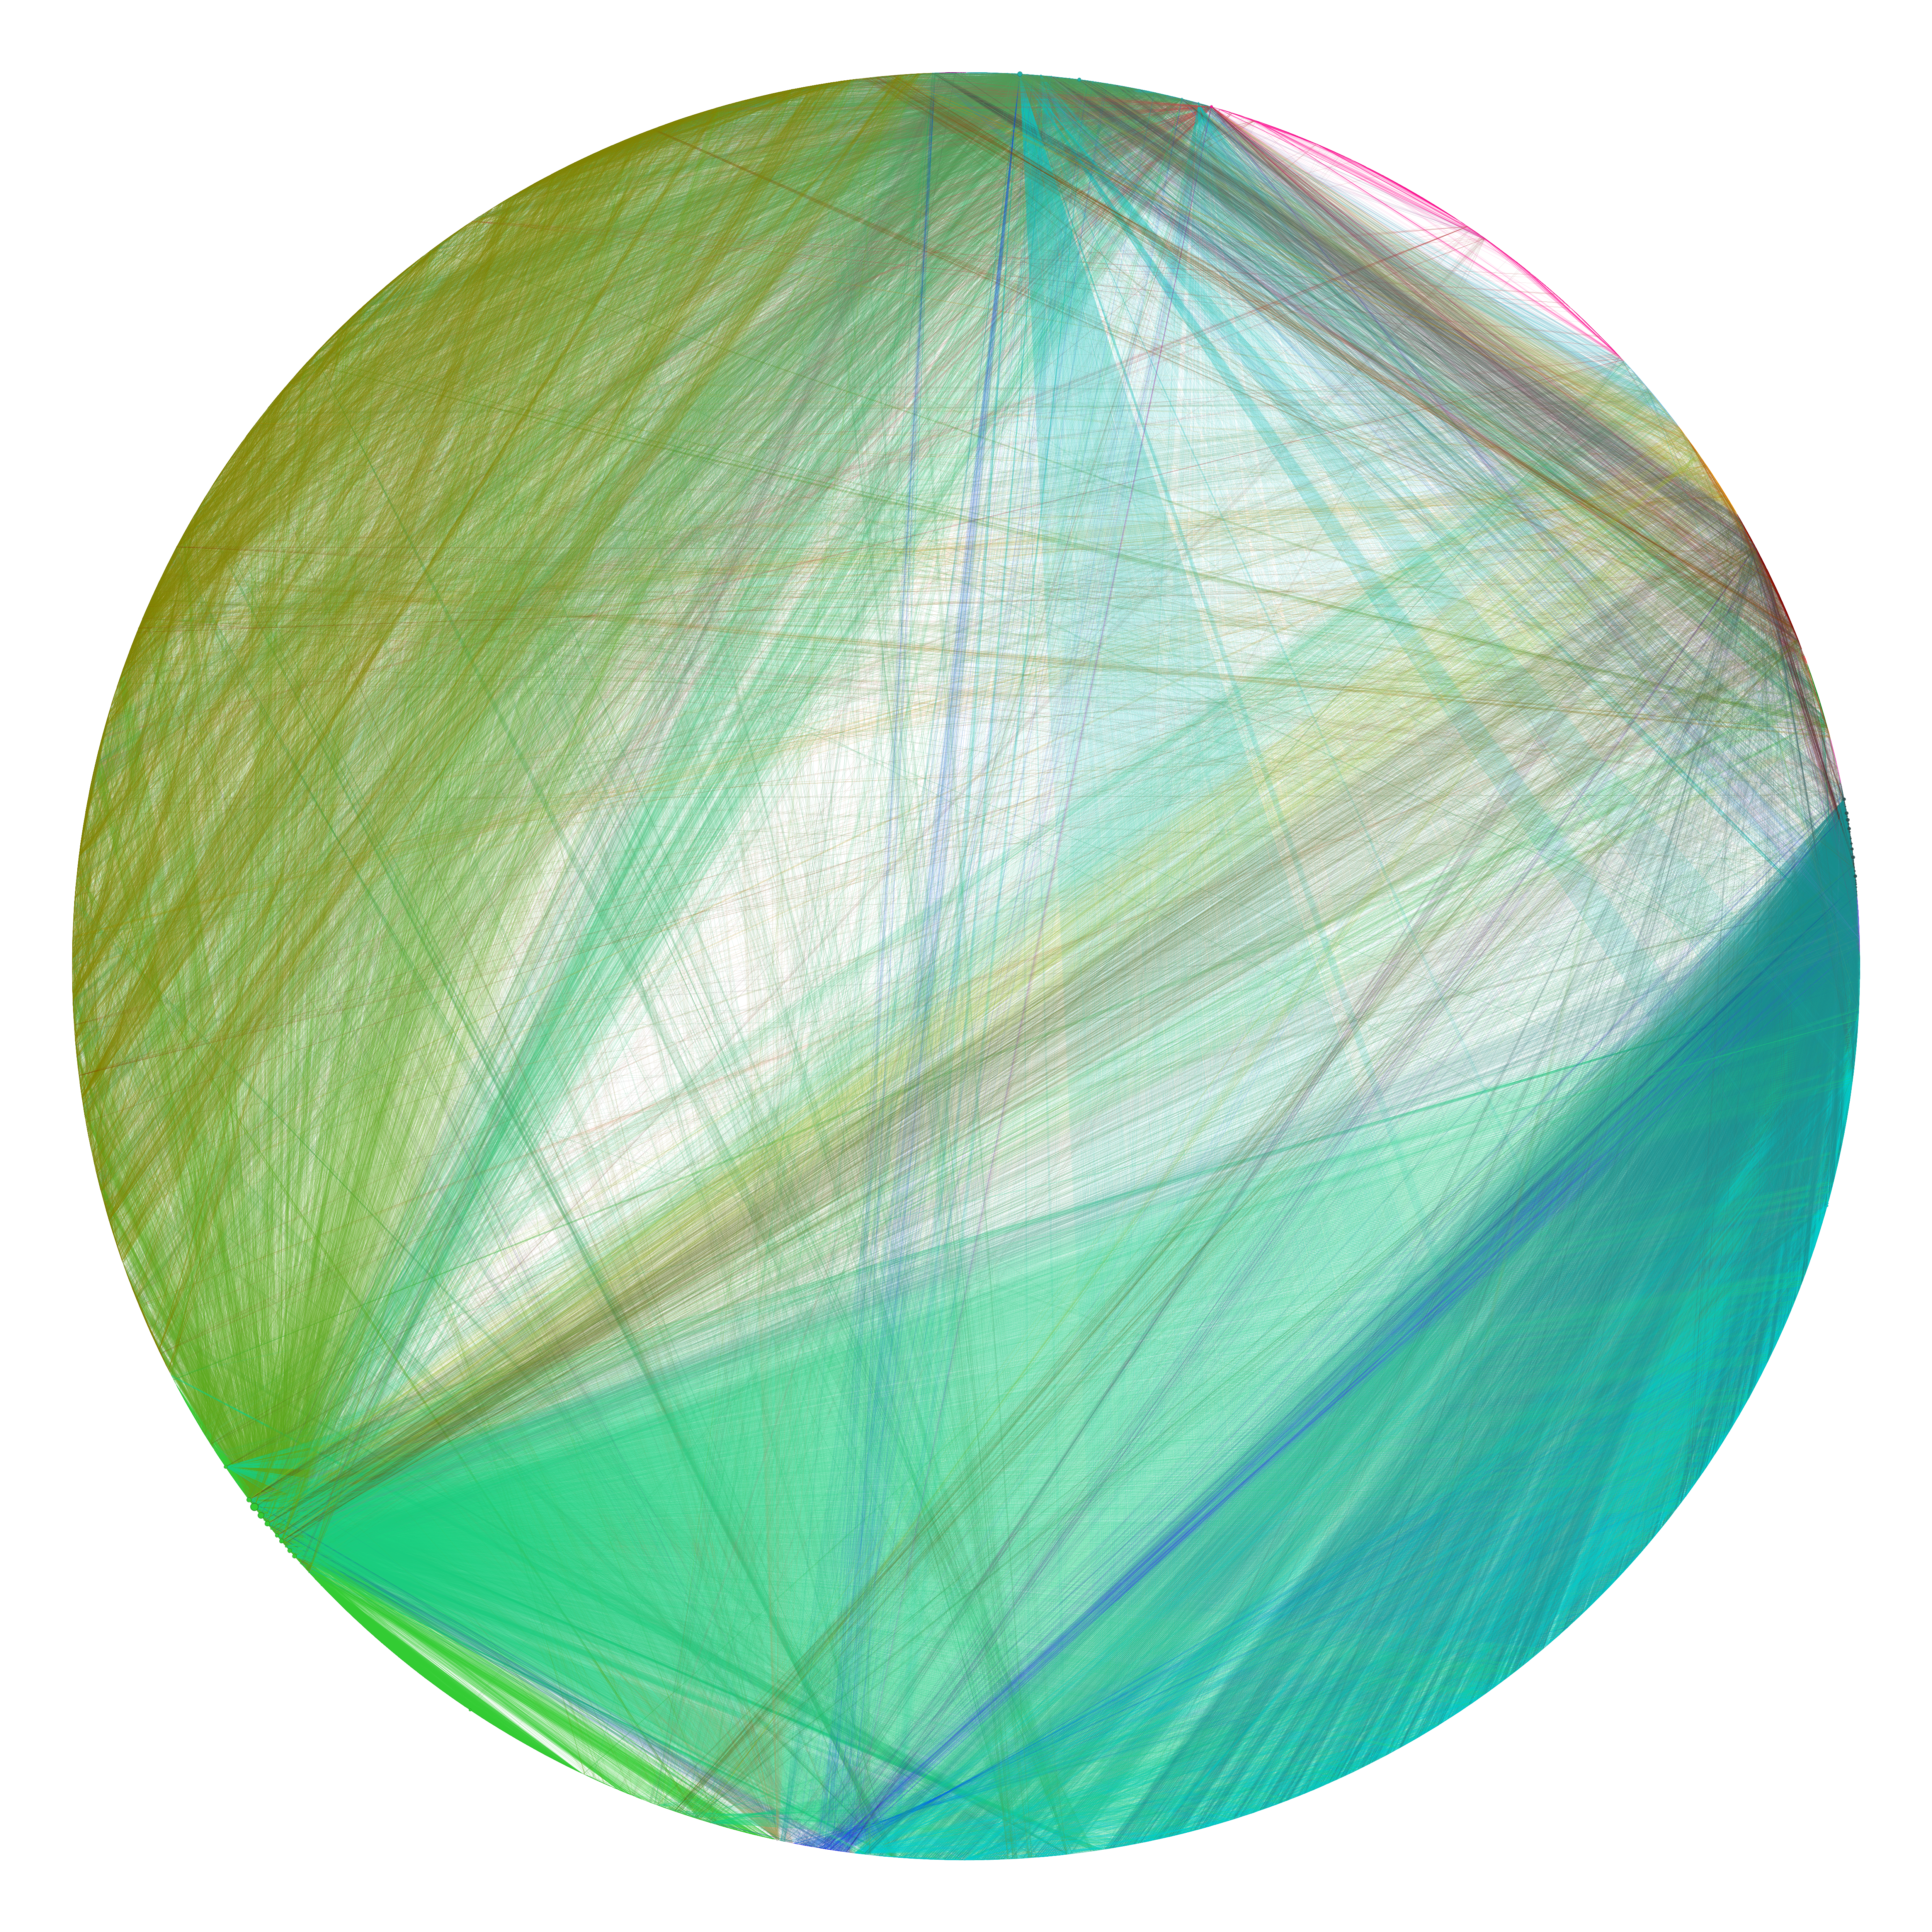
Circular Rectangular layout
Sadly, with the circular layout we’ve hit again the canvas limit in Gephi itself, the circle simply did not fit and was clipped to the maximum canvas size. I was not able to figure out how to fix this.
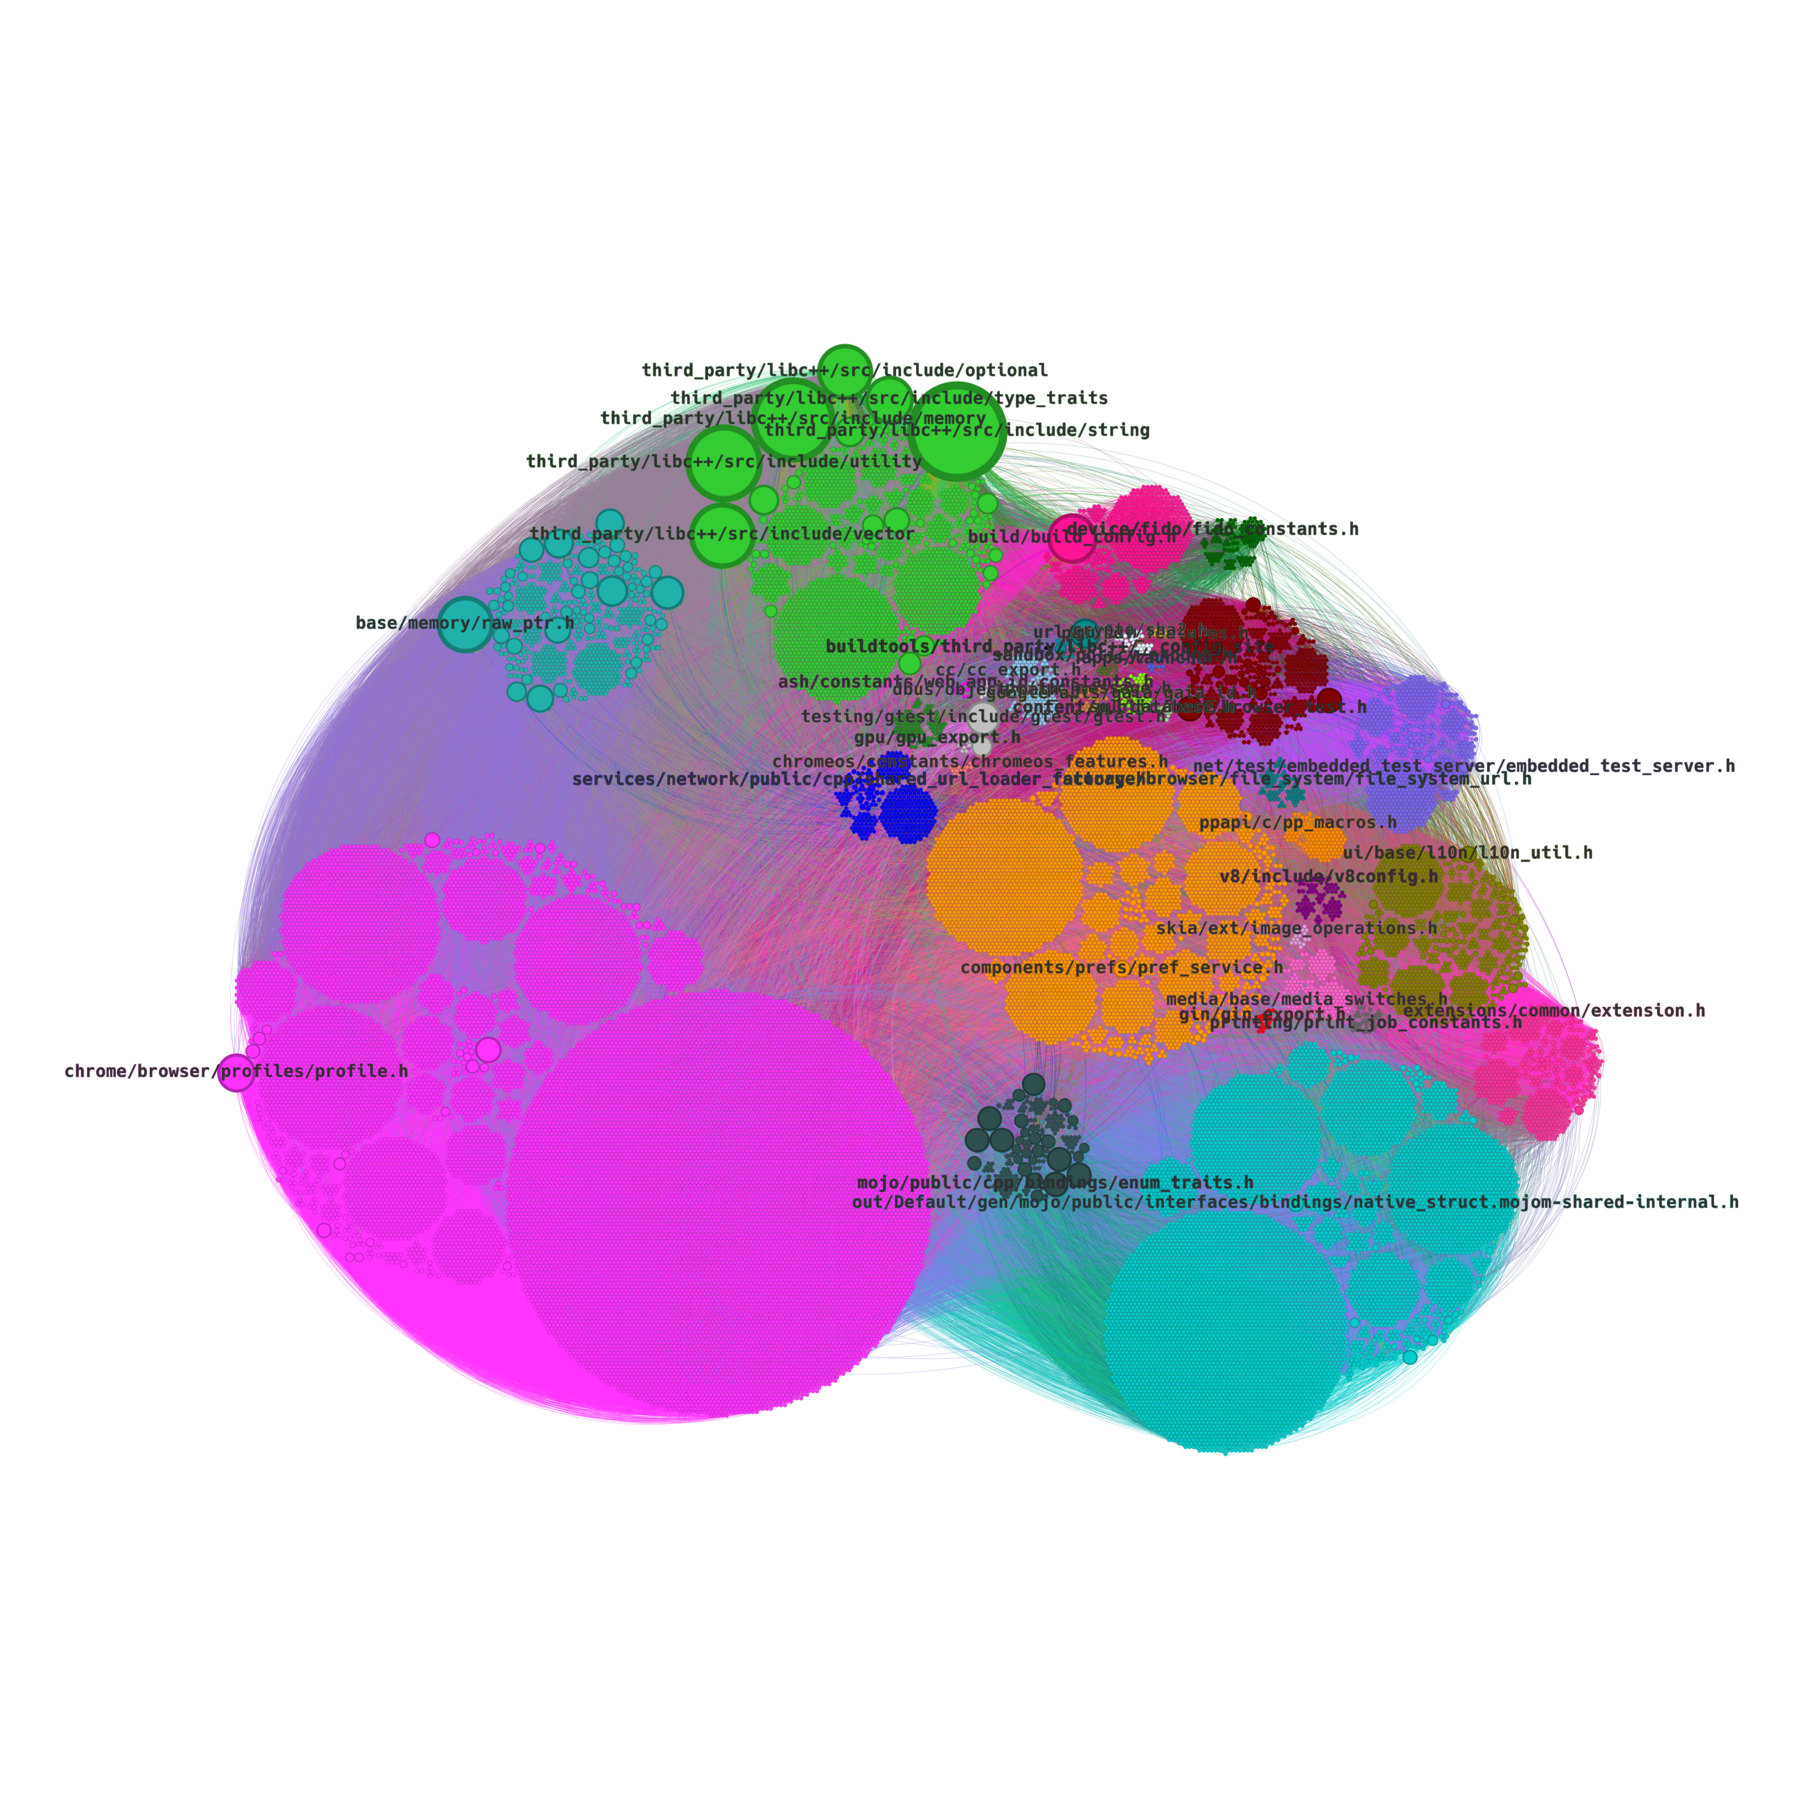
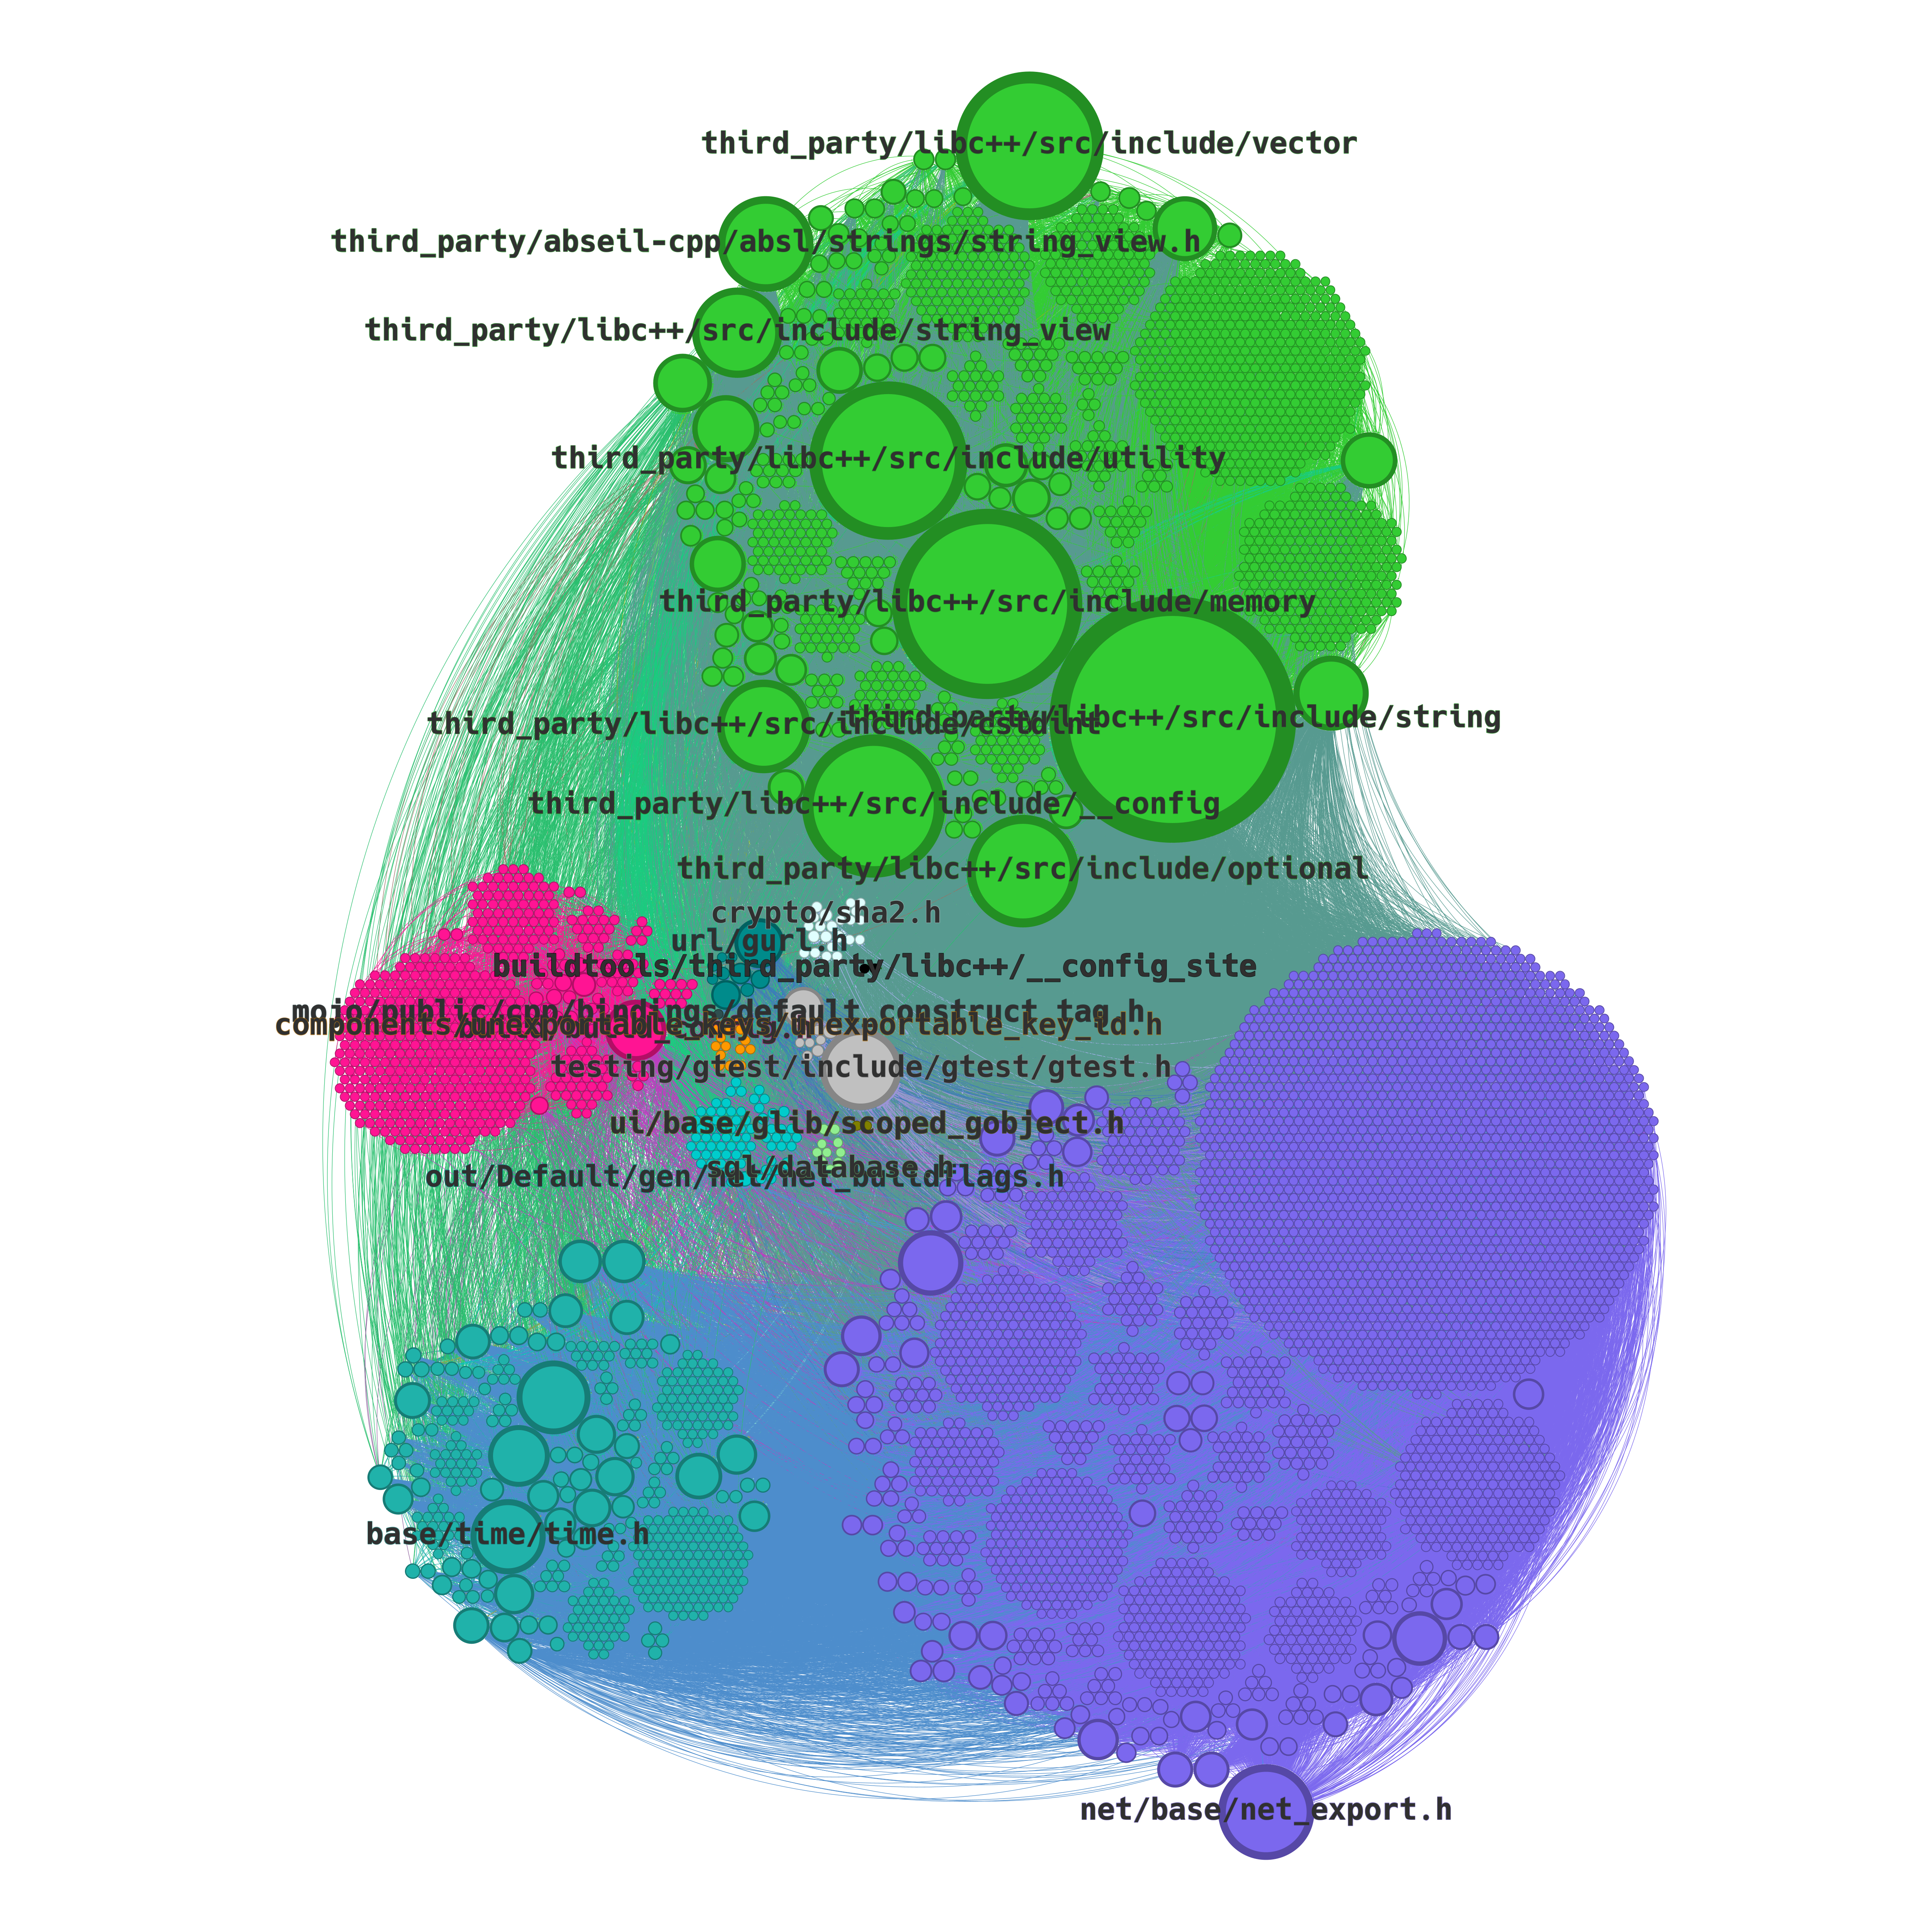
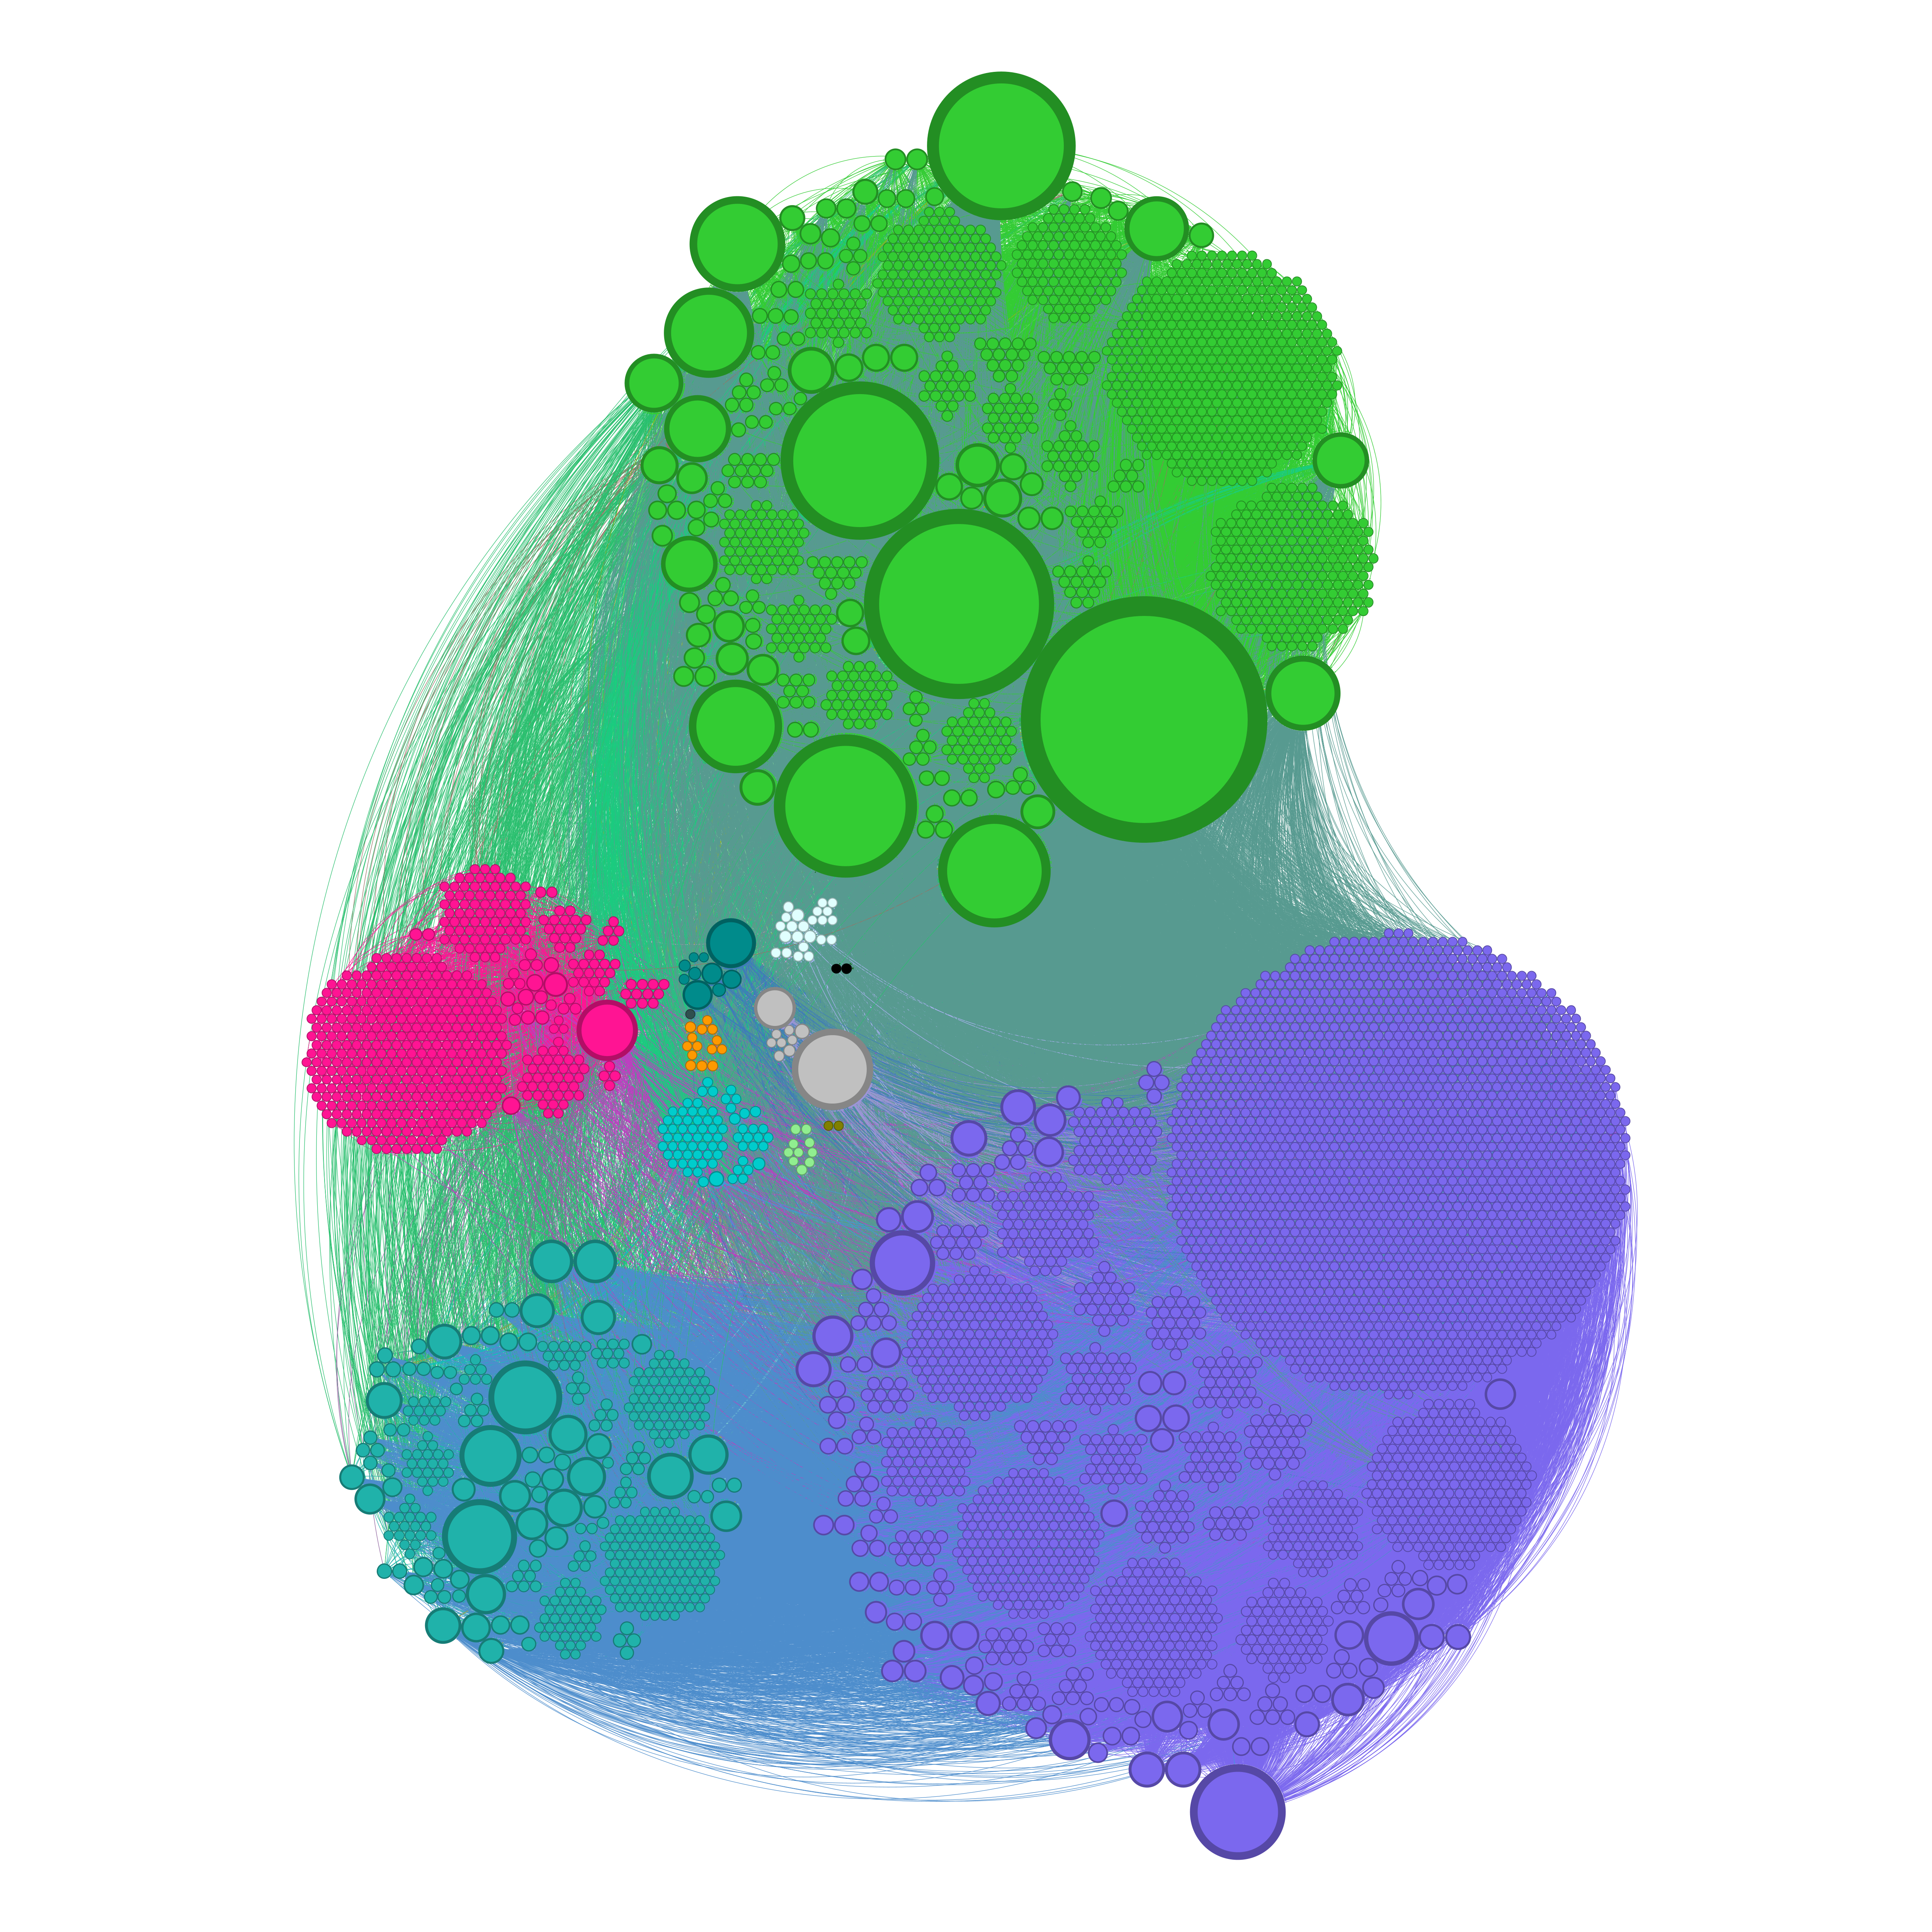
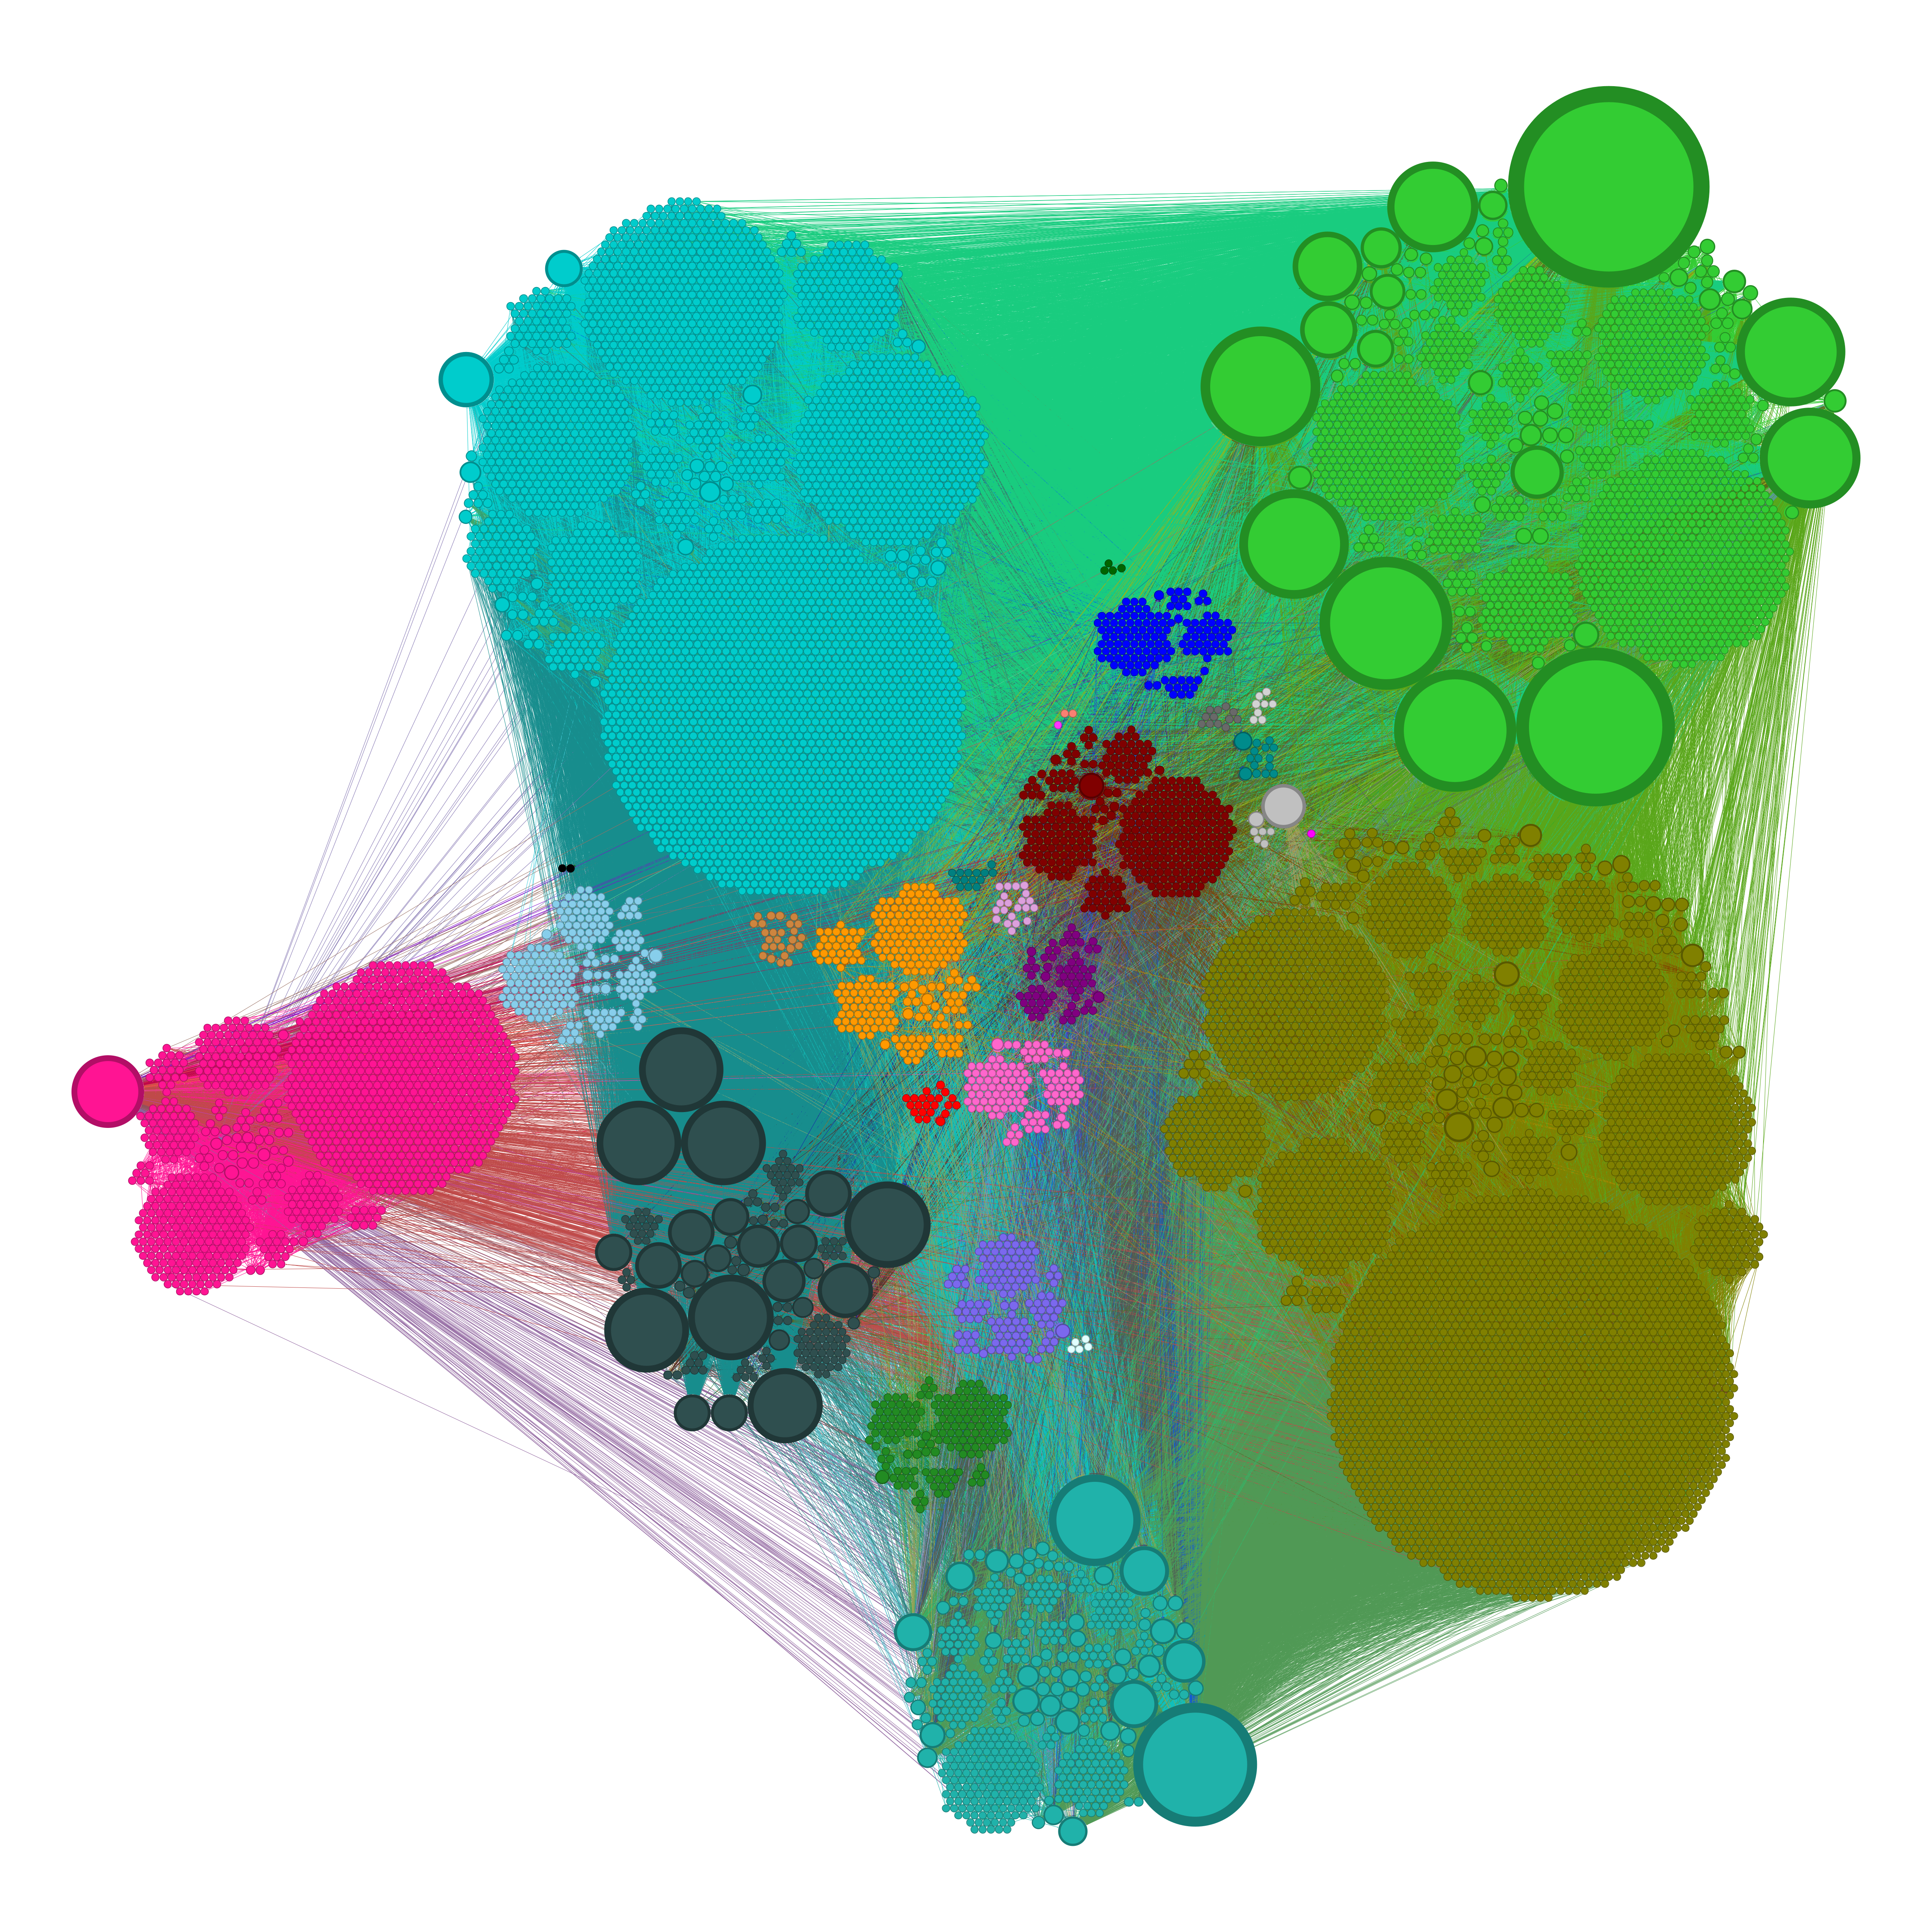
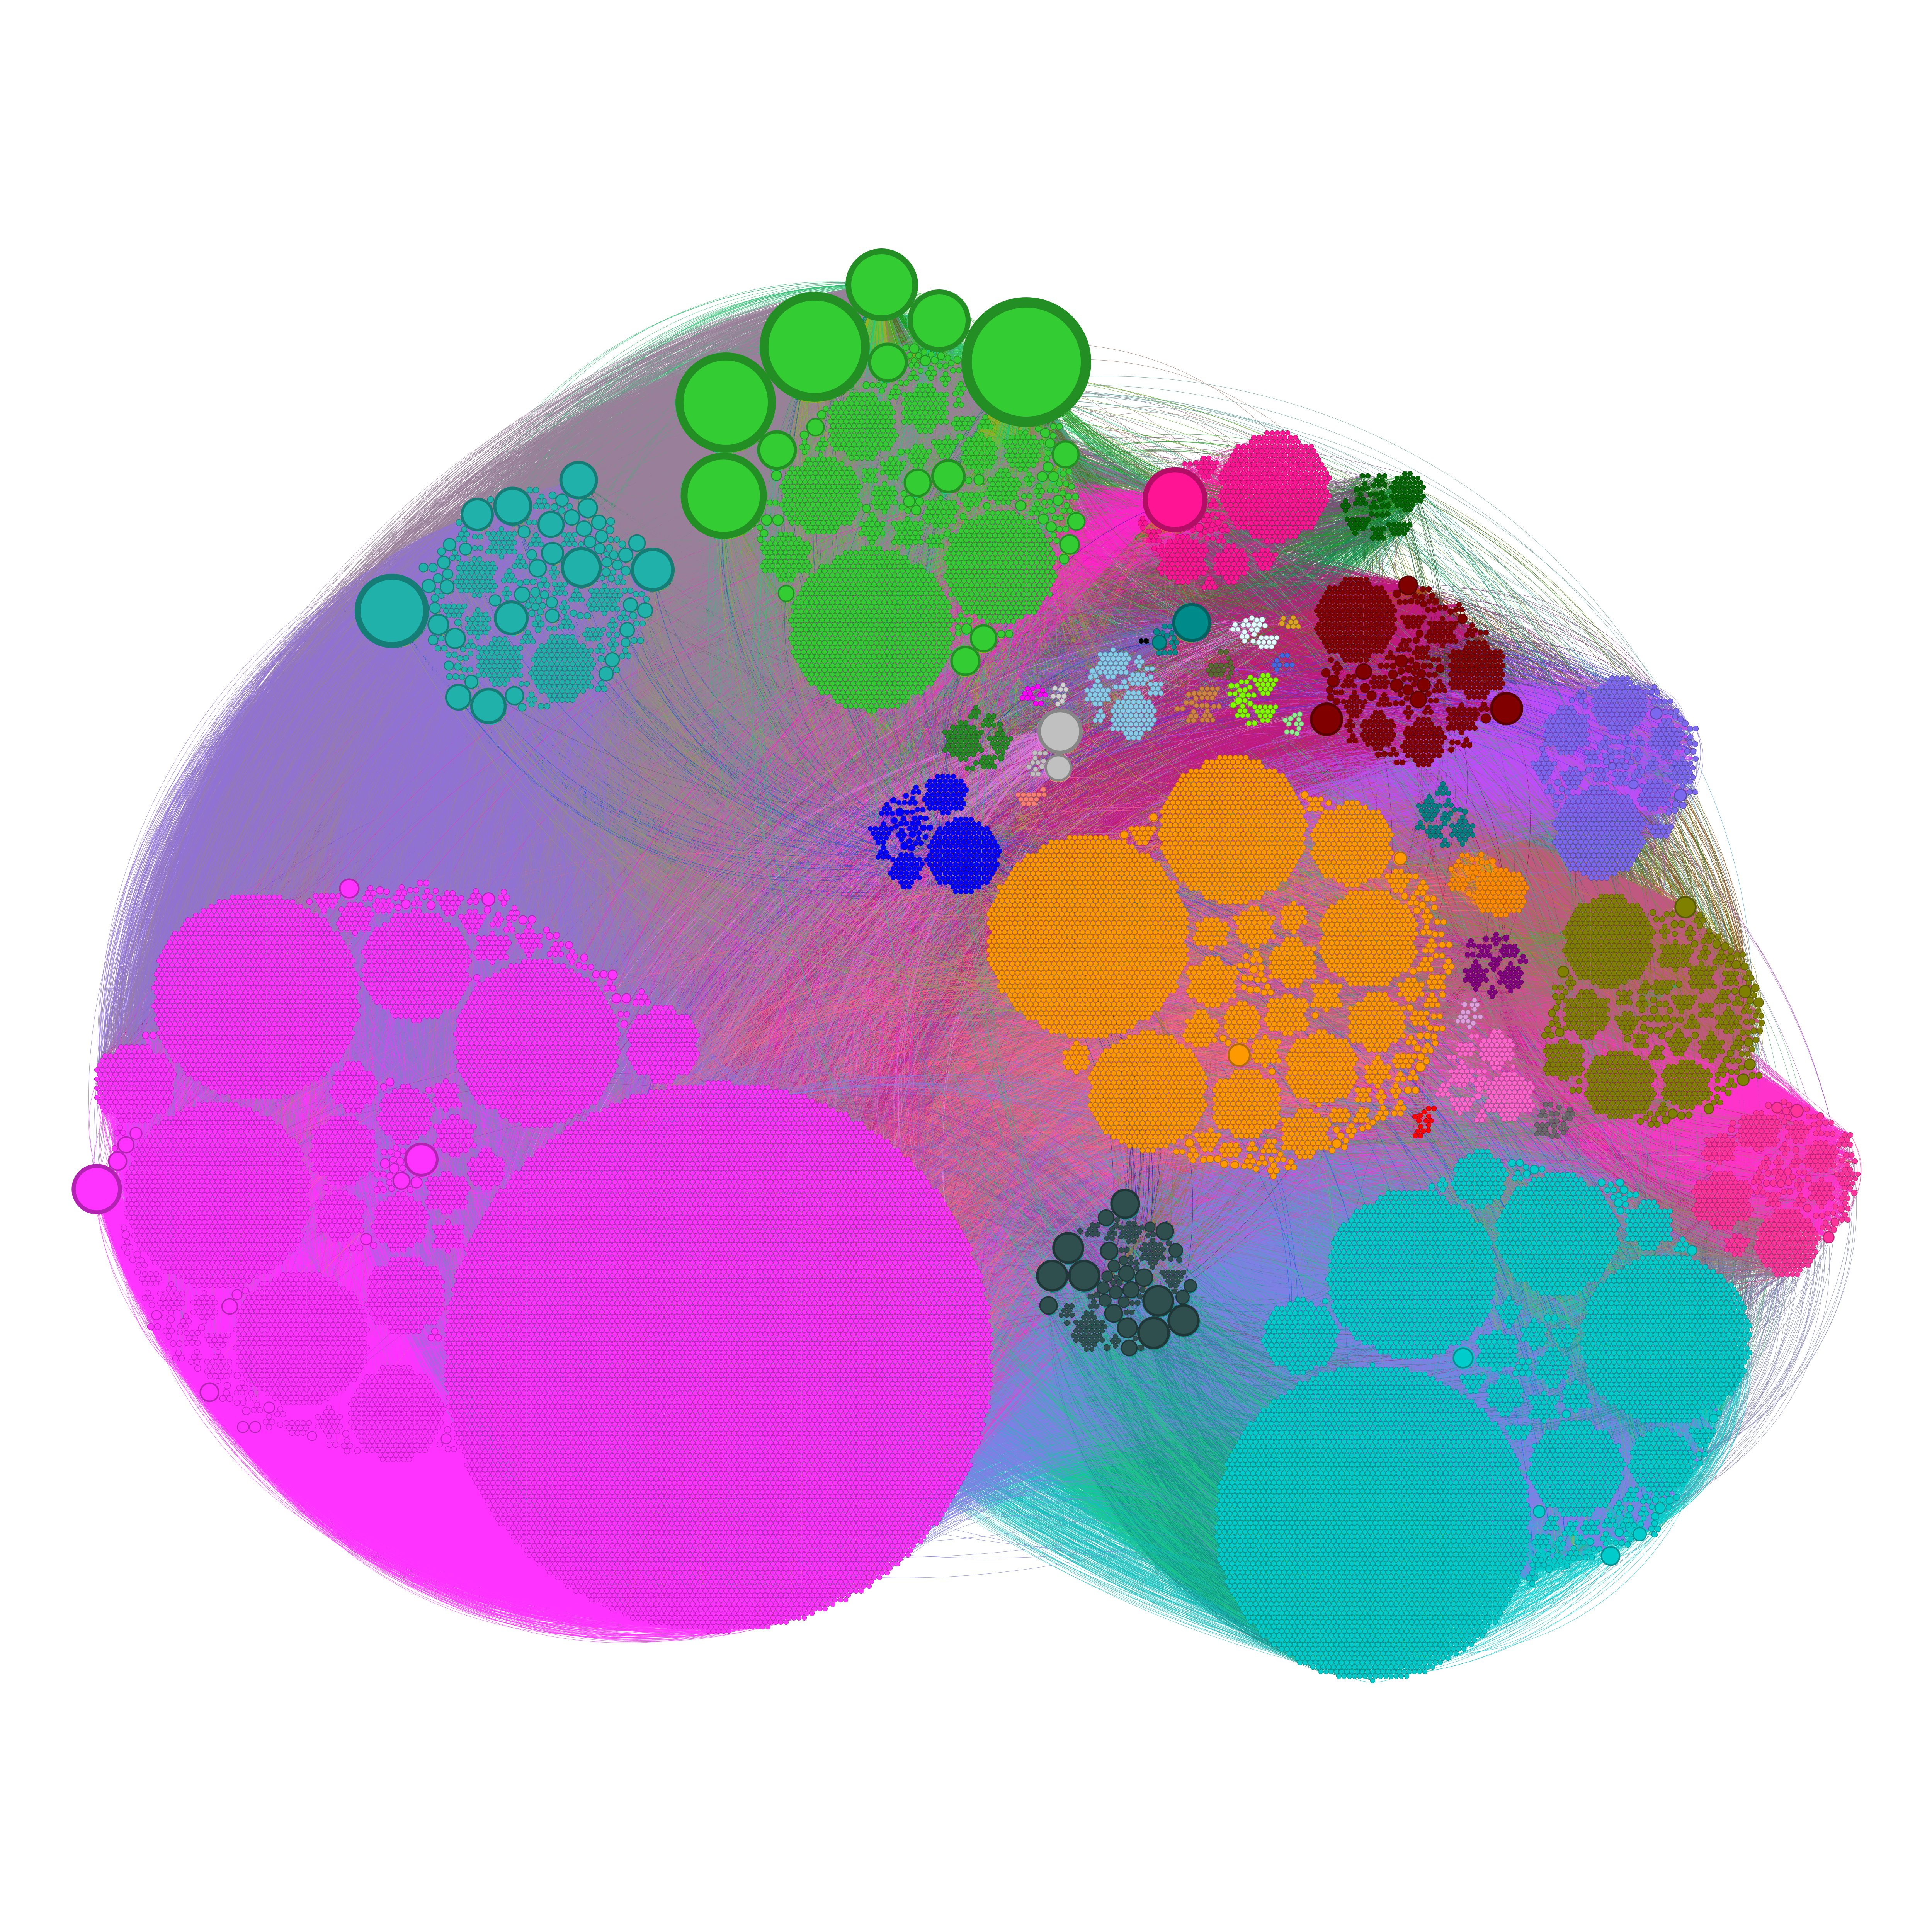
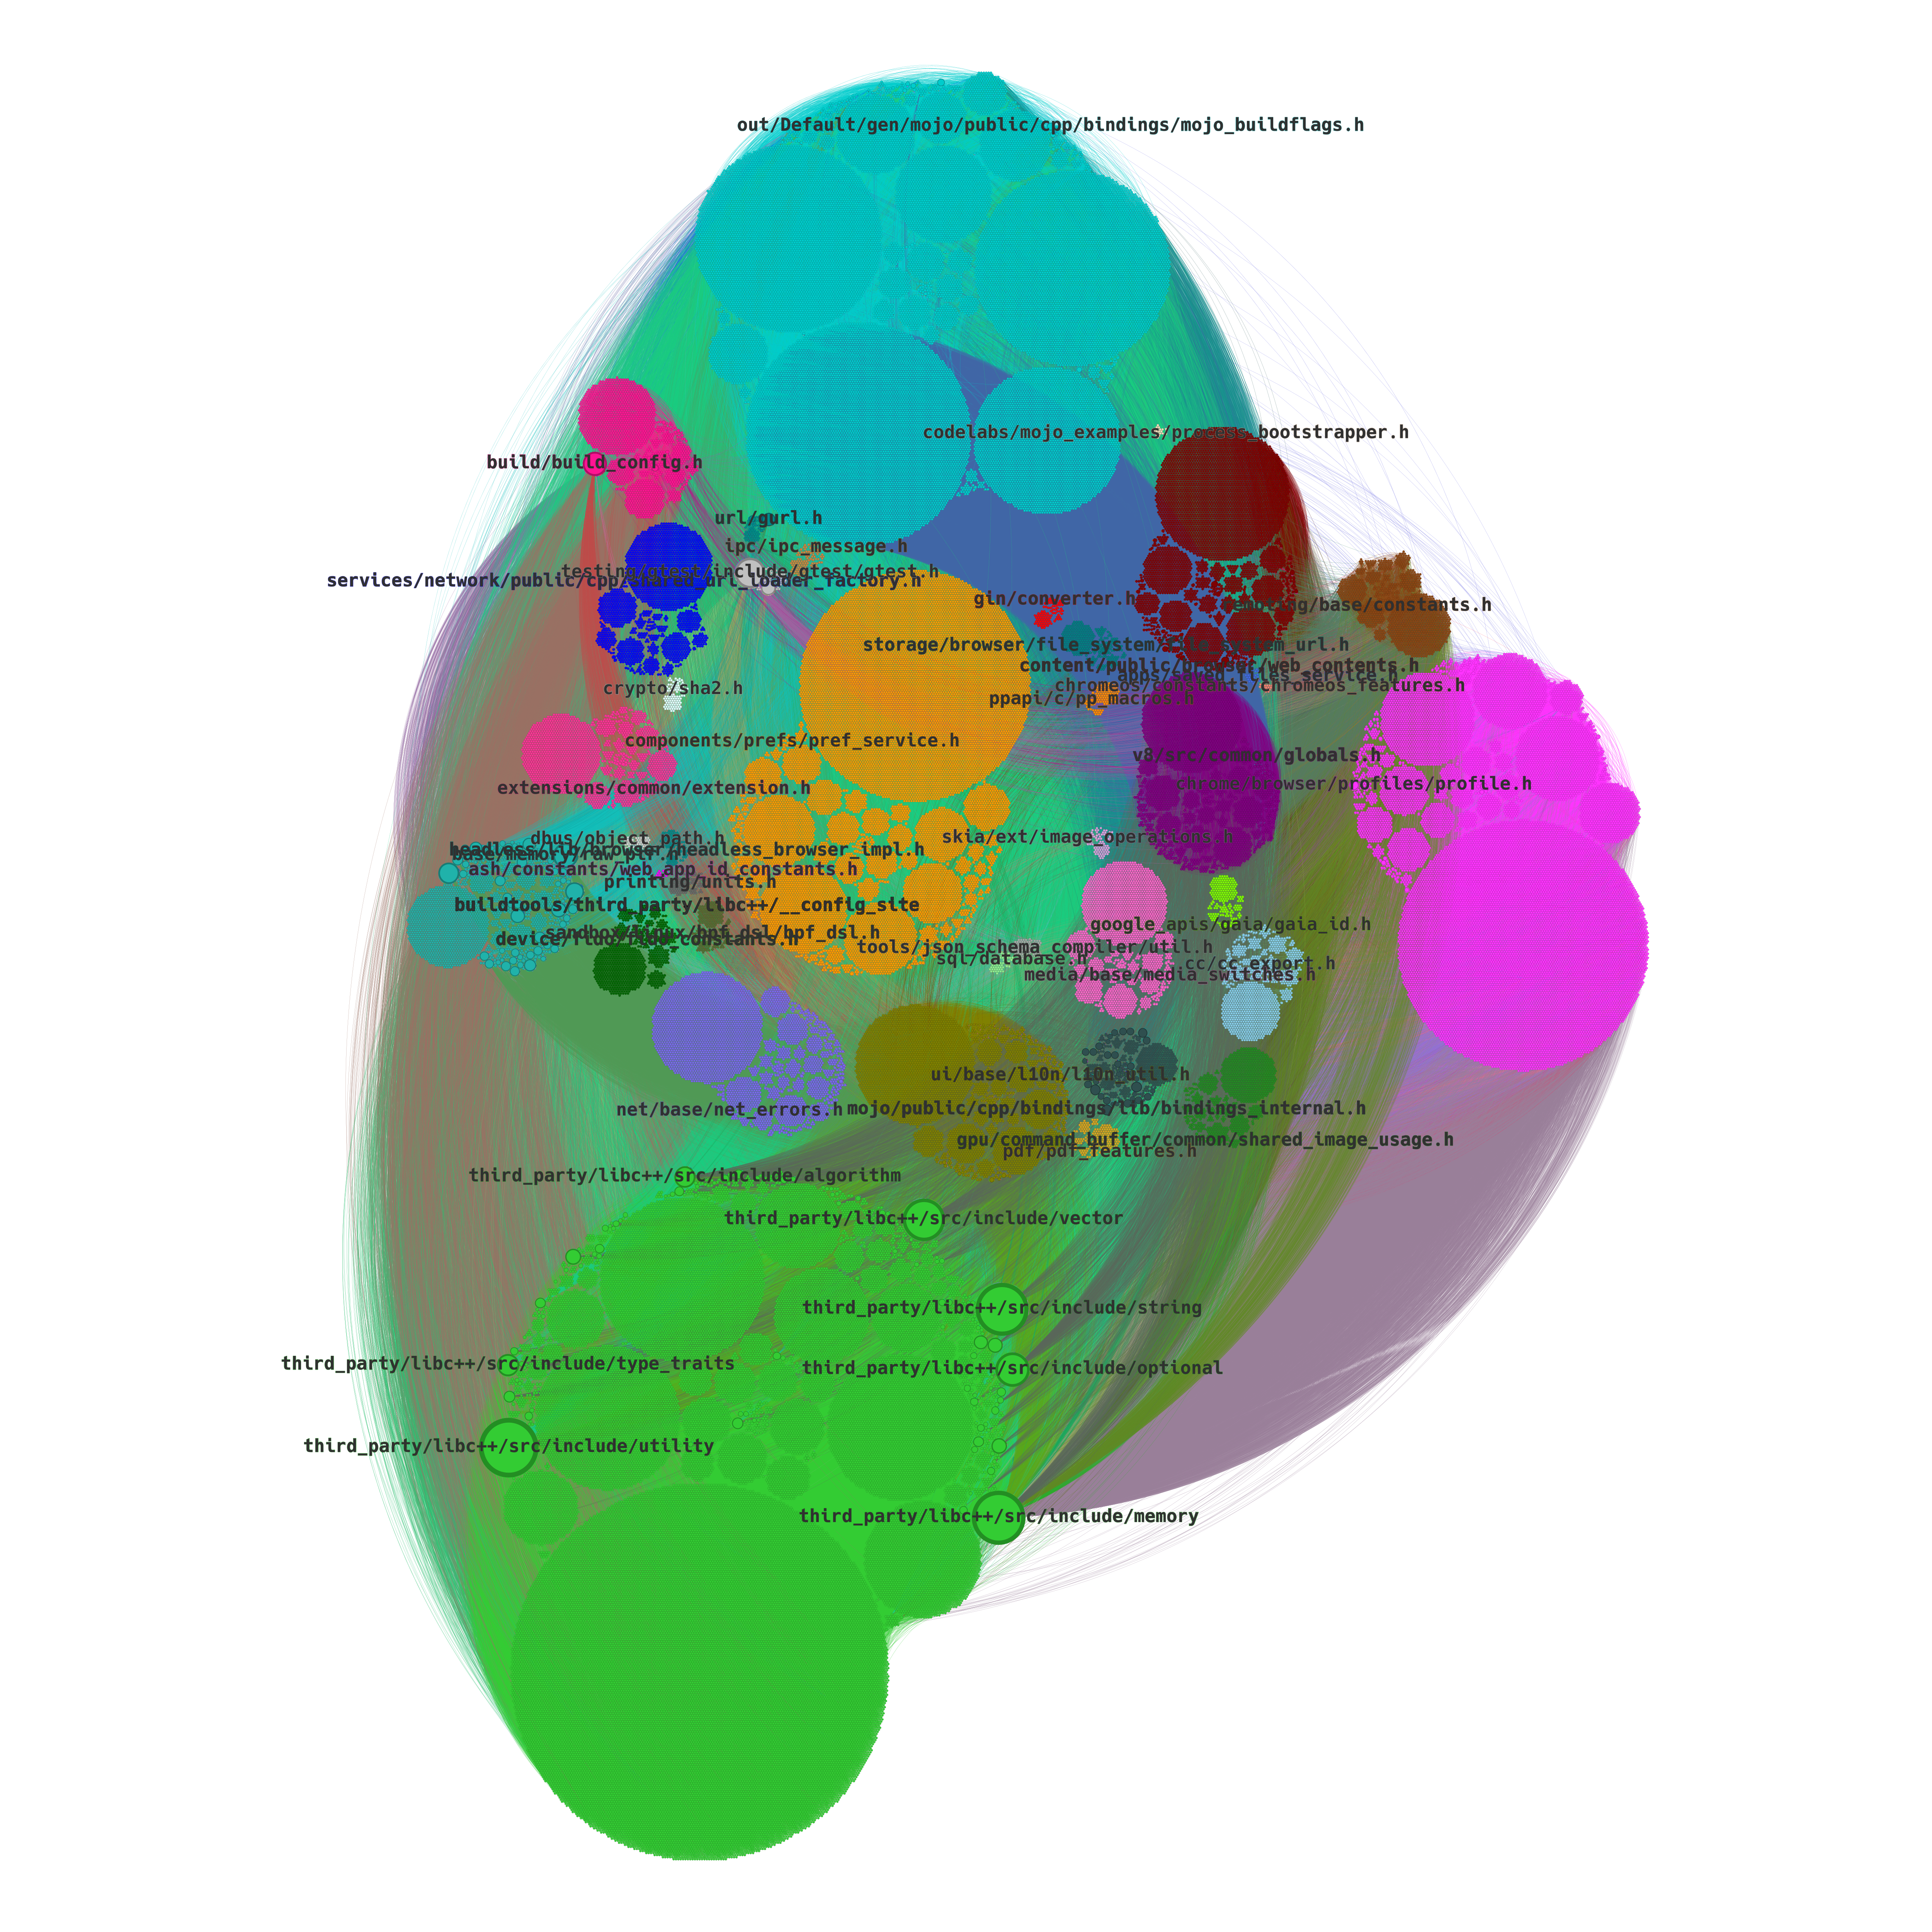
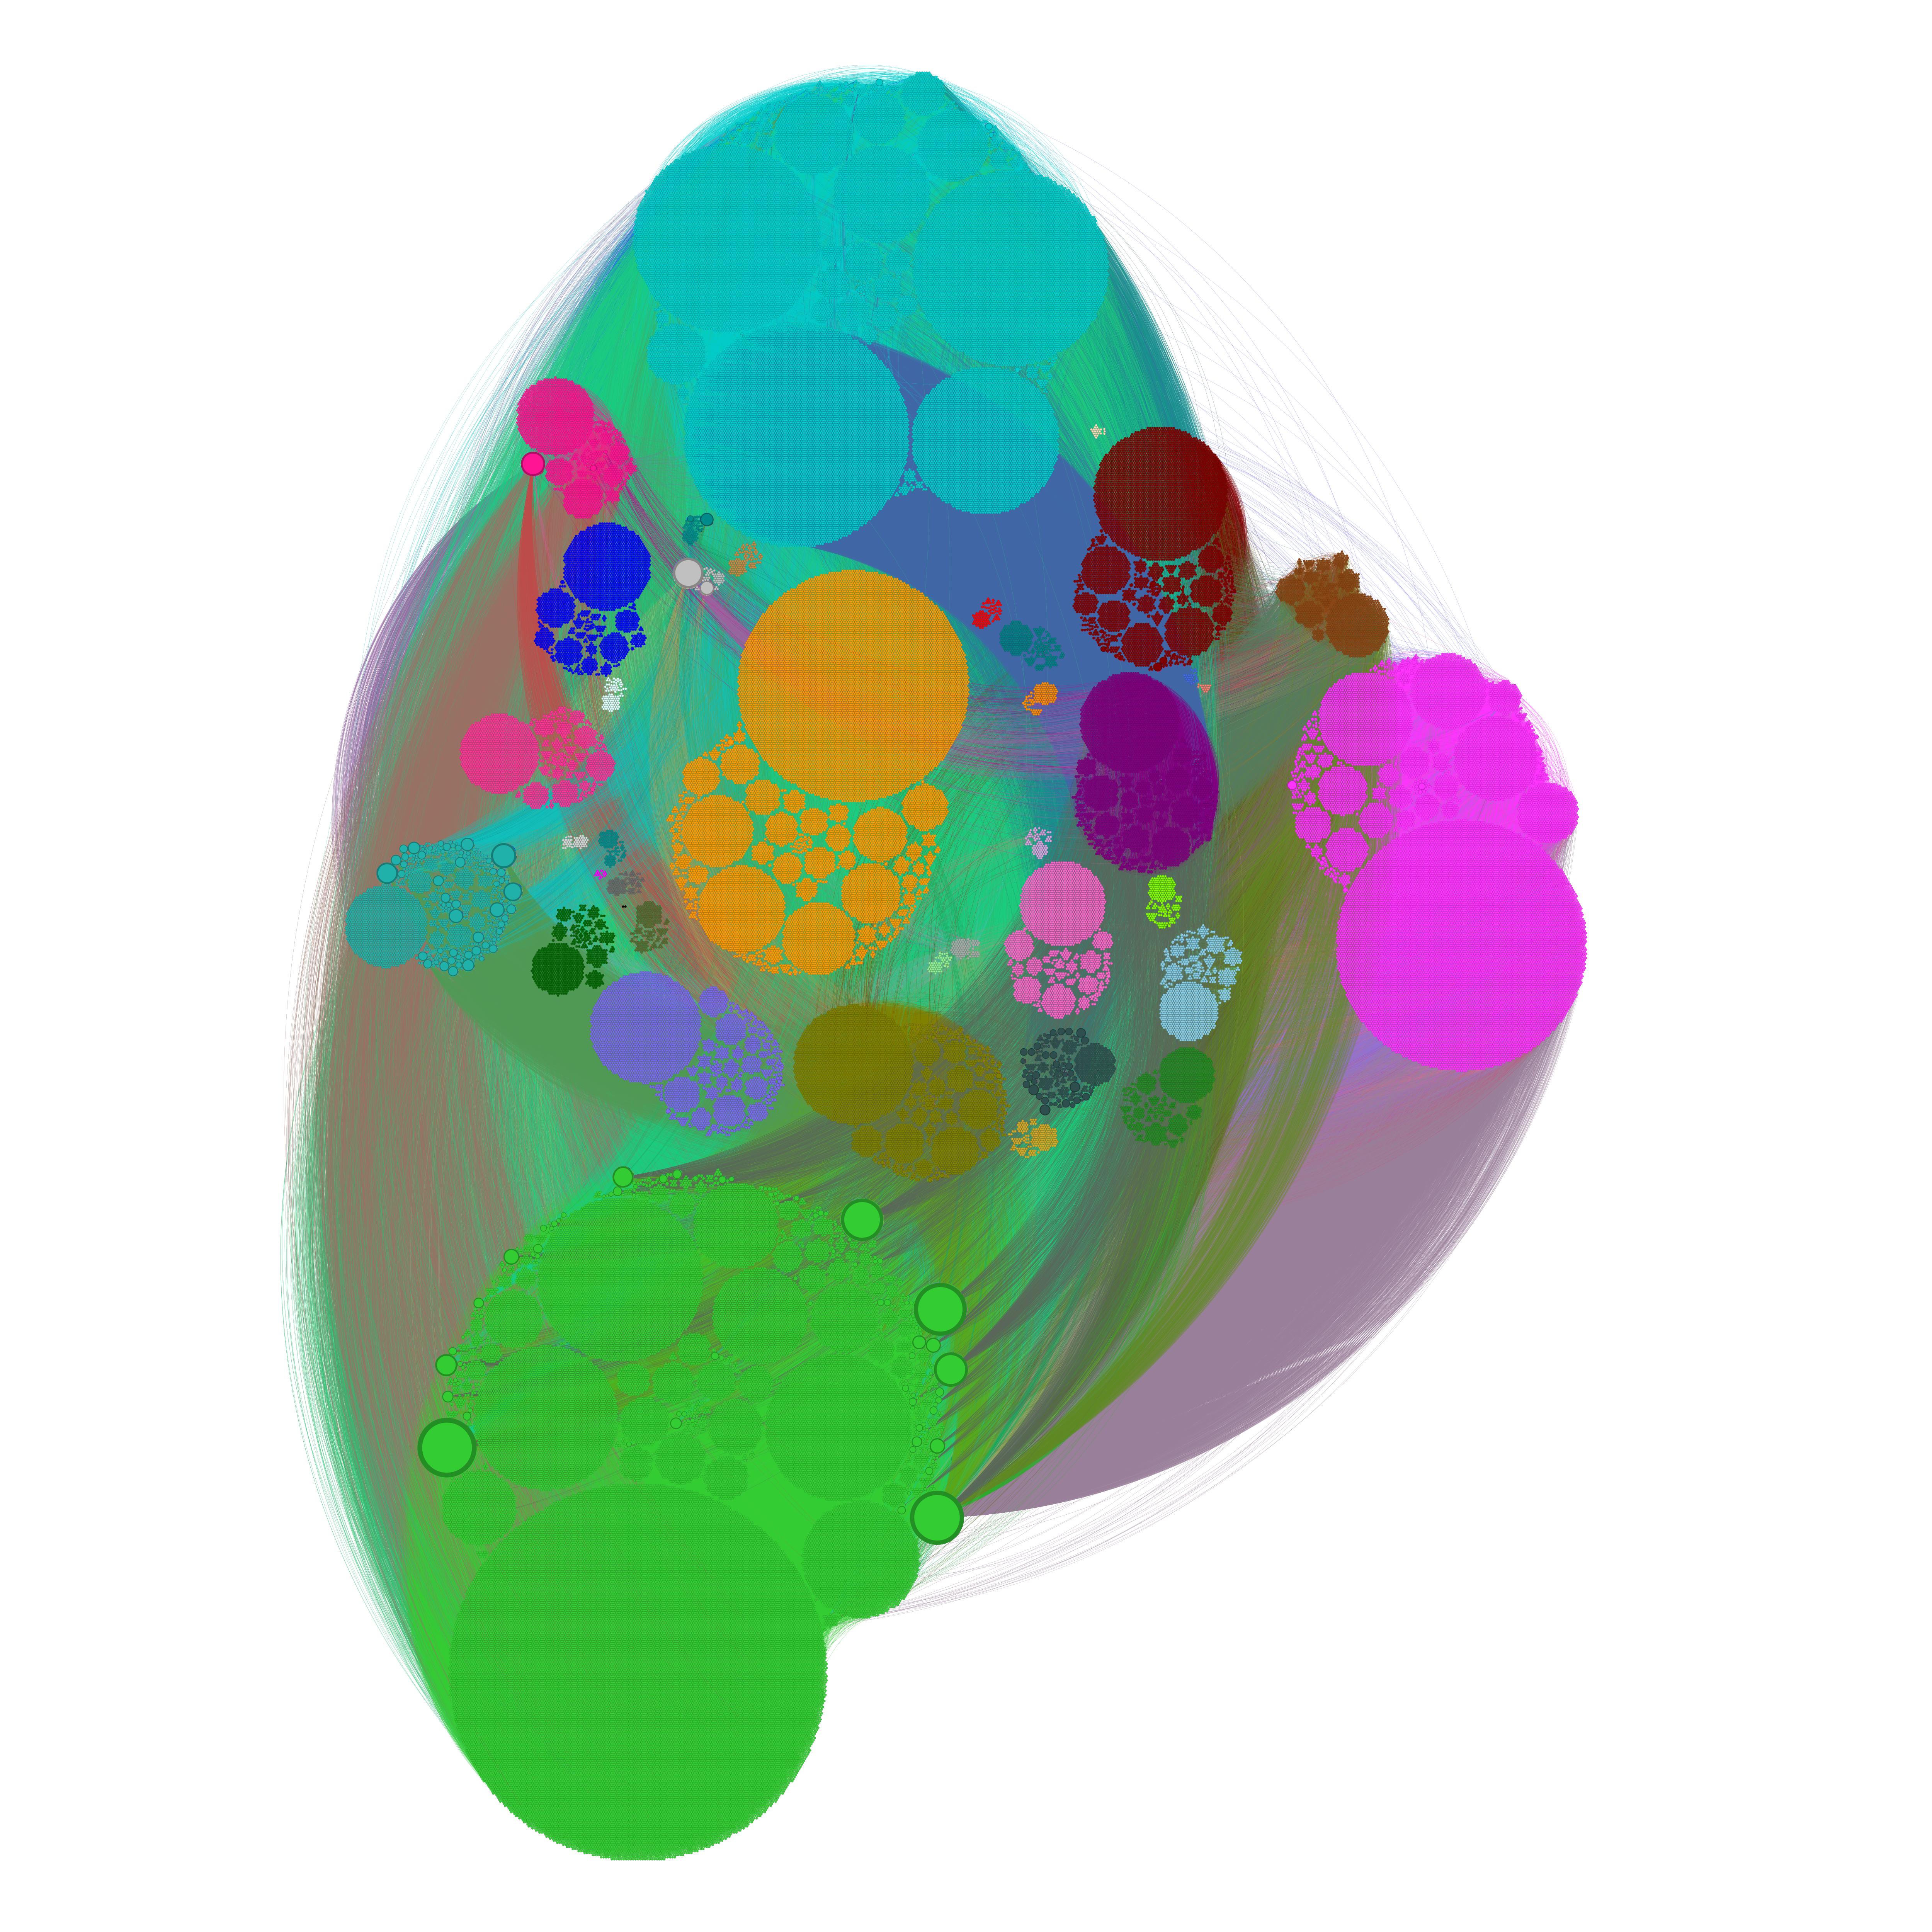
Circular pack layout
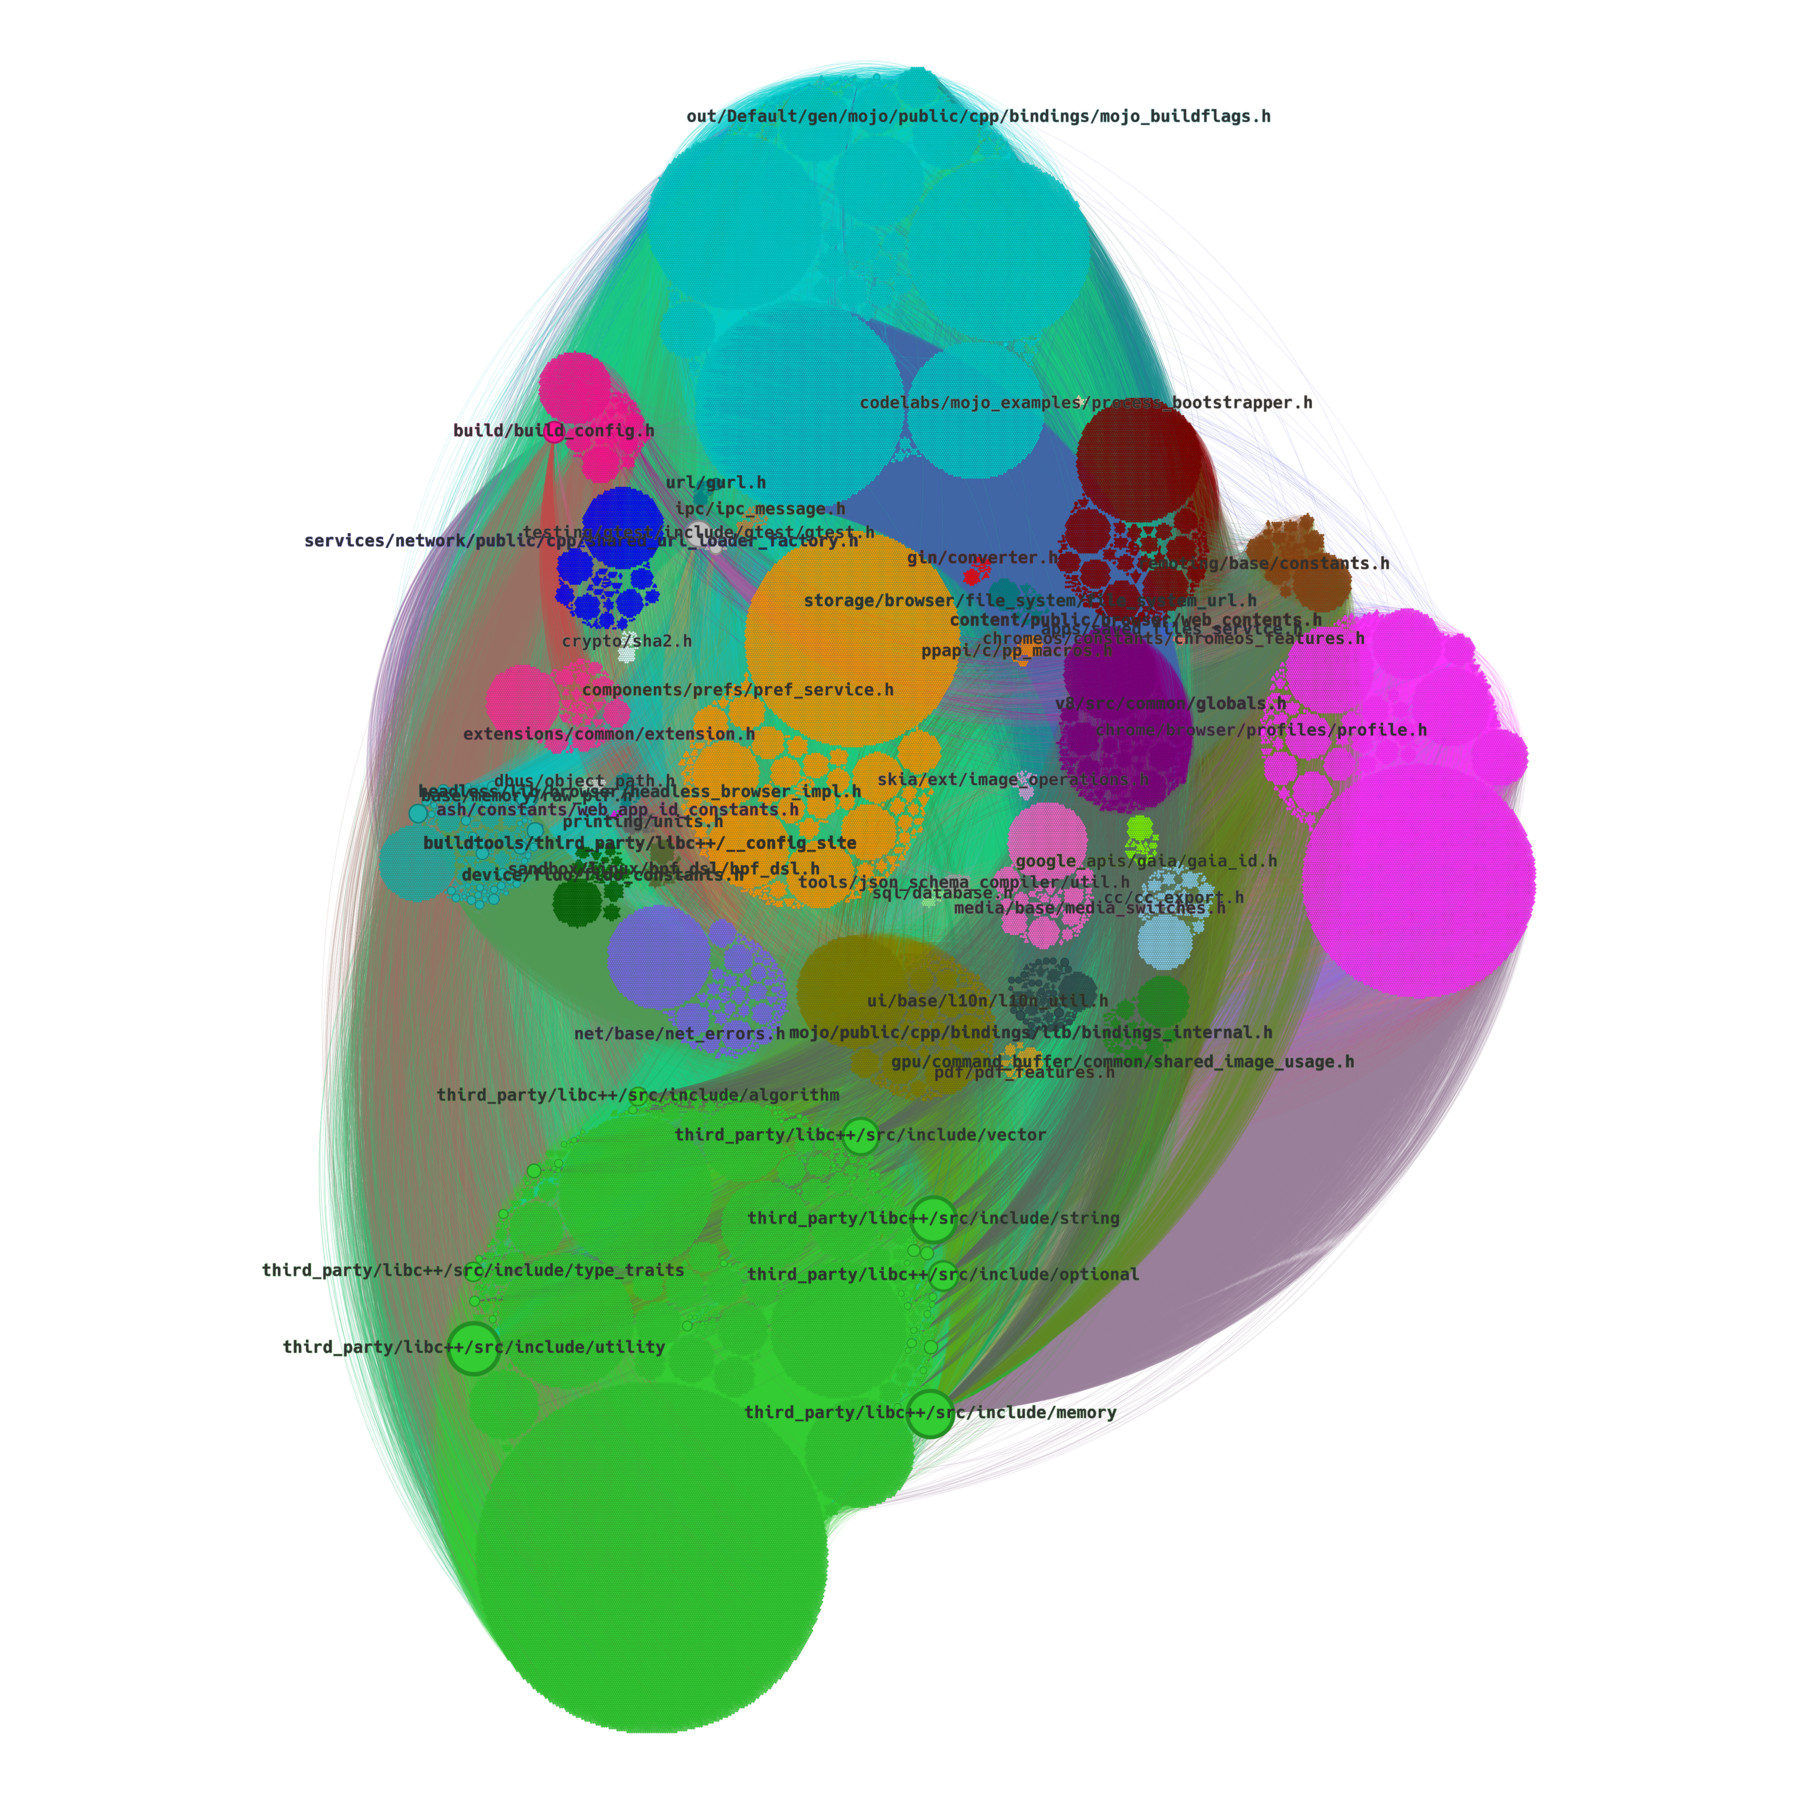
Here we can see how in the full graph everything is pretty much overshadowed by third_party and out components (which makes sense, third_party contains C++ headers and entire LLVM, while out contains huge amounts of automatically generated code).
Largest strongly connected component subgraph
While we’re here, we can also try to visualize the largest Strongly Connected Component, that according to the statistics calculated earlier had 92 nodes and was fully contained withing the v8 subdirectory. For this we’ll need another script, which will find the largest SCC nodes and extract a GraphML subgraph from the full graph - and this is what it looks like (with YifanHu layout):
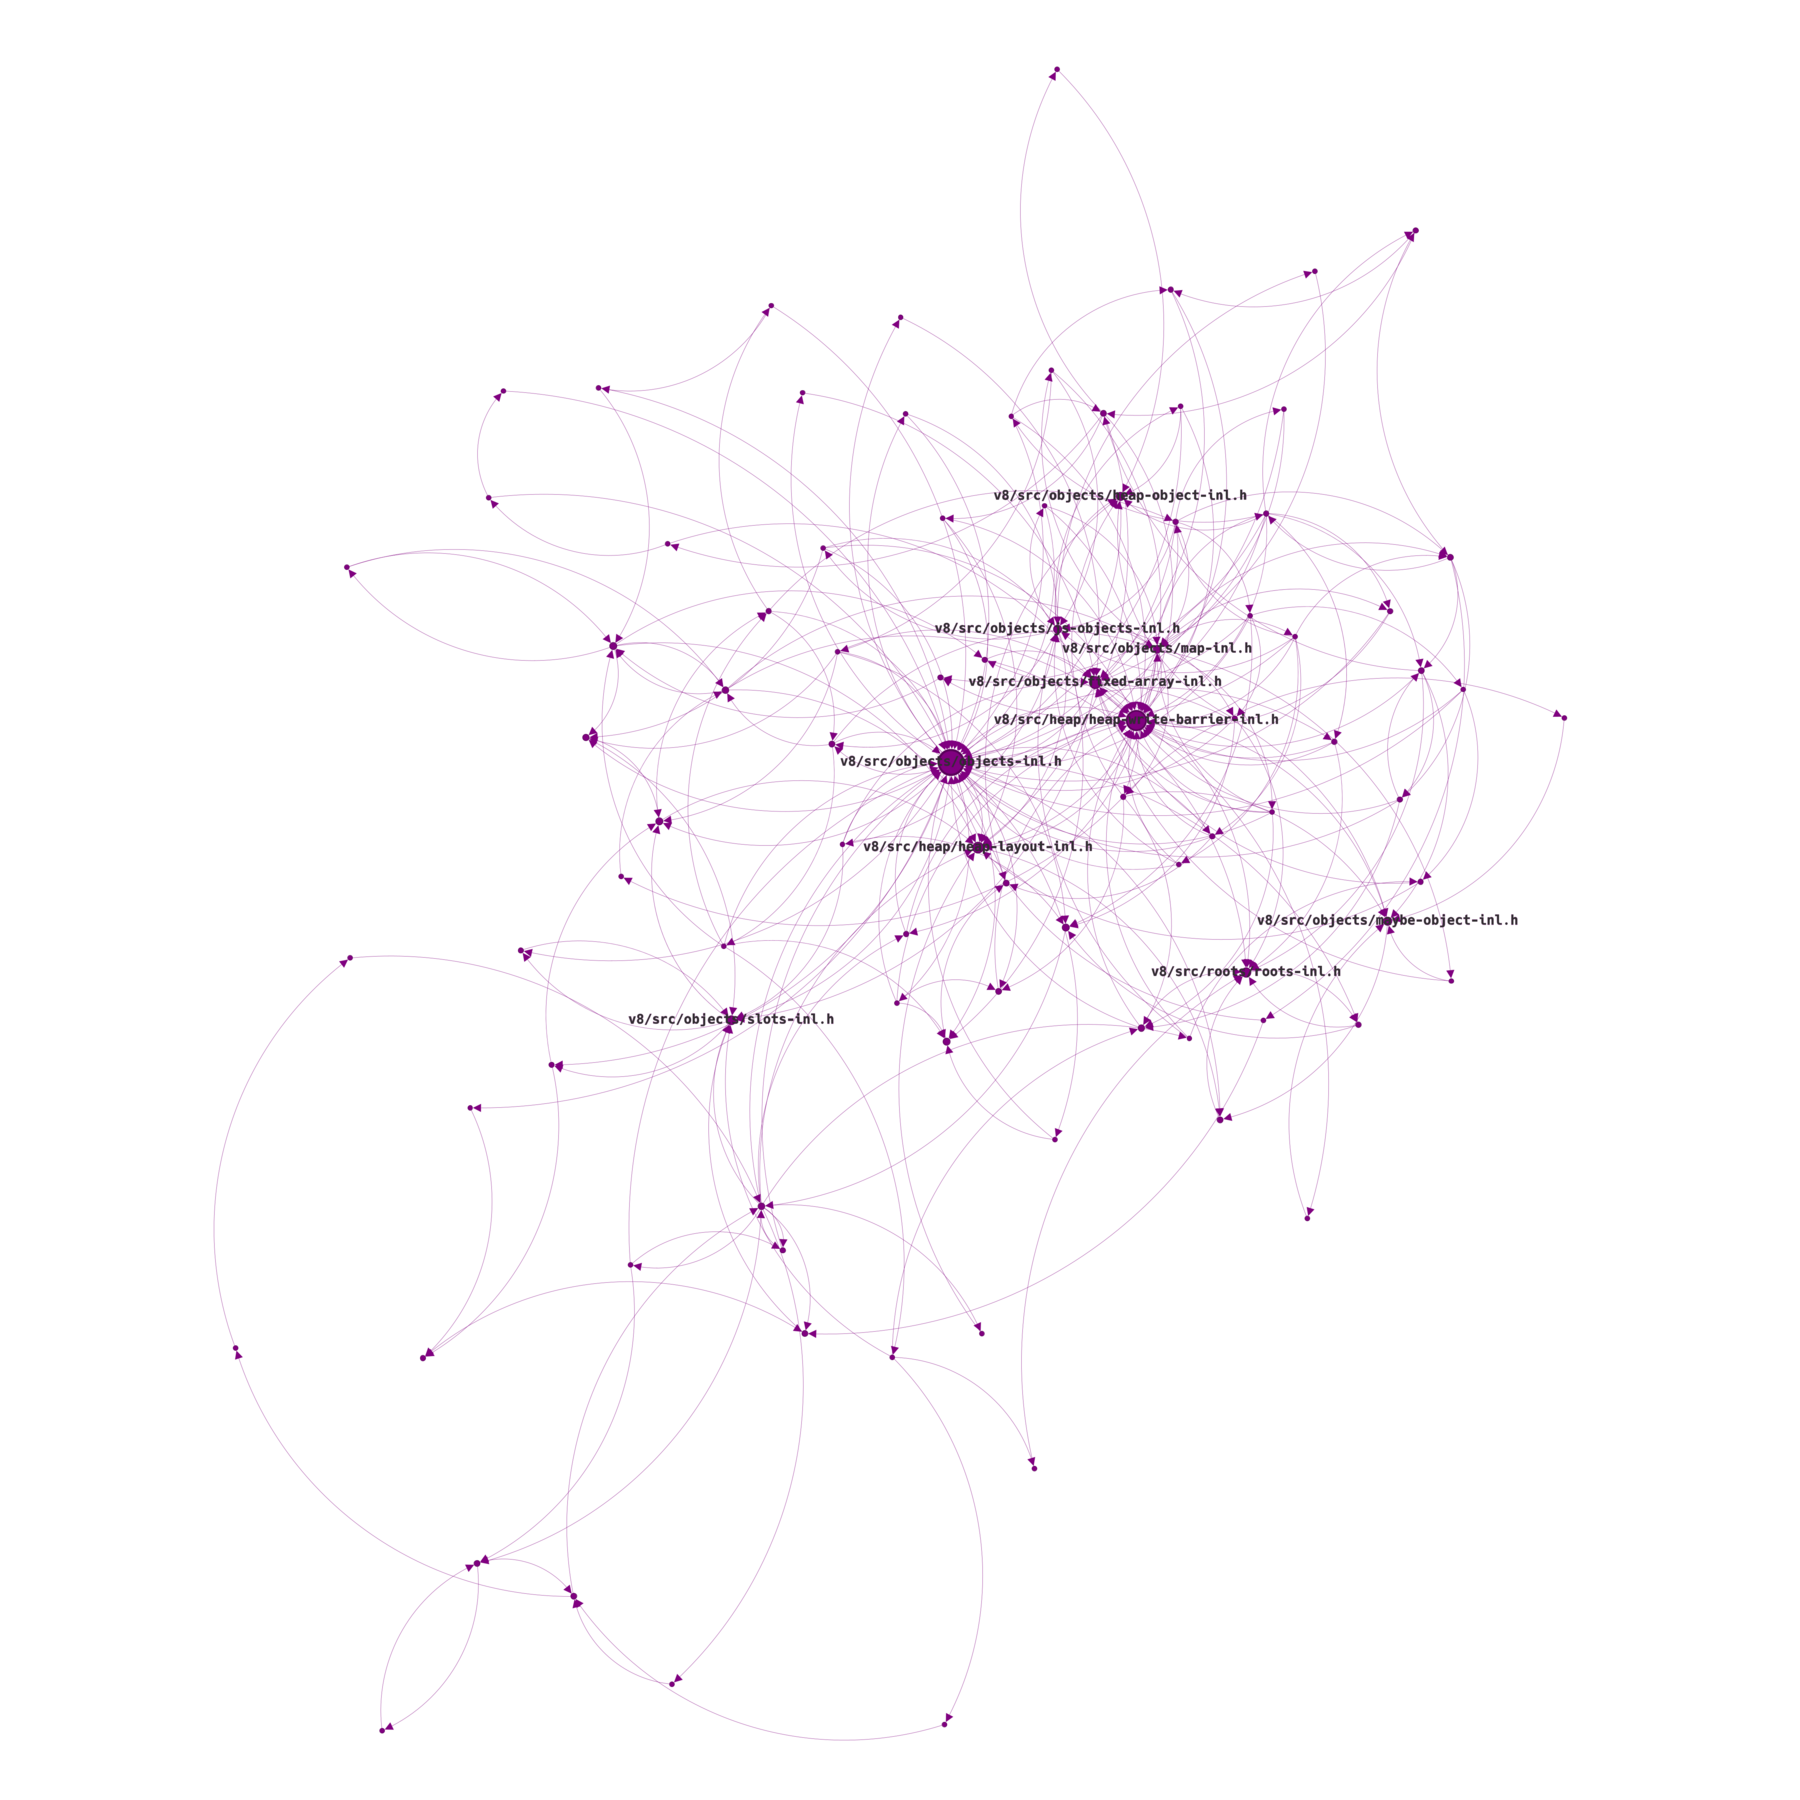
Again, SCC means that starting from any node in this subgraph, you can get through the (directed) edges to any other node in this subgraph. Or in other words, this subgraph has no dead-ends.
After running the calculate_statistics.py script on this subgraph, it turns out that, even though this subgraph has only 92 nodes and 282 edges, it apparently contributes 99% cycles to the the entire include graph (7'809'335 out of 7'809'709)!
Conclusions
I’m not going to argue the usability of these graphs, especially taking into account time needed to create them manually using Gephi UI, but personally to me at least a few of them are simply pretty to look at.
As stated in the beginning, the main purpose here was to test clang-include-graph against Chromium to see if it can handle such large code base in acceptable time, and that was a success.
Some remarks:
- Gephi is definitely a very capable tool, although with a few caveats (limited canvas size)
- Automating generation of these graphs could be possible in Java using Gephi Toolkit, but I haven’t tried it
- For future work, it would definitely be interesting to visualize include graphs (or at least calculate metrics) for a few popular projects and compare them (are they modular or rather tightly interconnected)
- Currently
clang-include-graph’s glob pattern handling is unnecessarily slow on very large source directories, this should be refactored
Links
- clang-include-graph GitHub page
- Gephi project website
- NetworkX library website
- compile_commands.json (for reference)
- GitHub repository with all scripts and Dockerfile
—
